
BTC/USDT
Our first example is actually going to be a crypto trade we took in October 2020.
This trade turned into such a good trade that we can’t not feature it, and it just goes to show that the strategy works in all the markets. All the way from Forex to Stocks and, of course, Crypto.
Let’s go step by step on how we played out this trade.
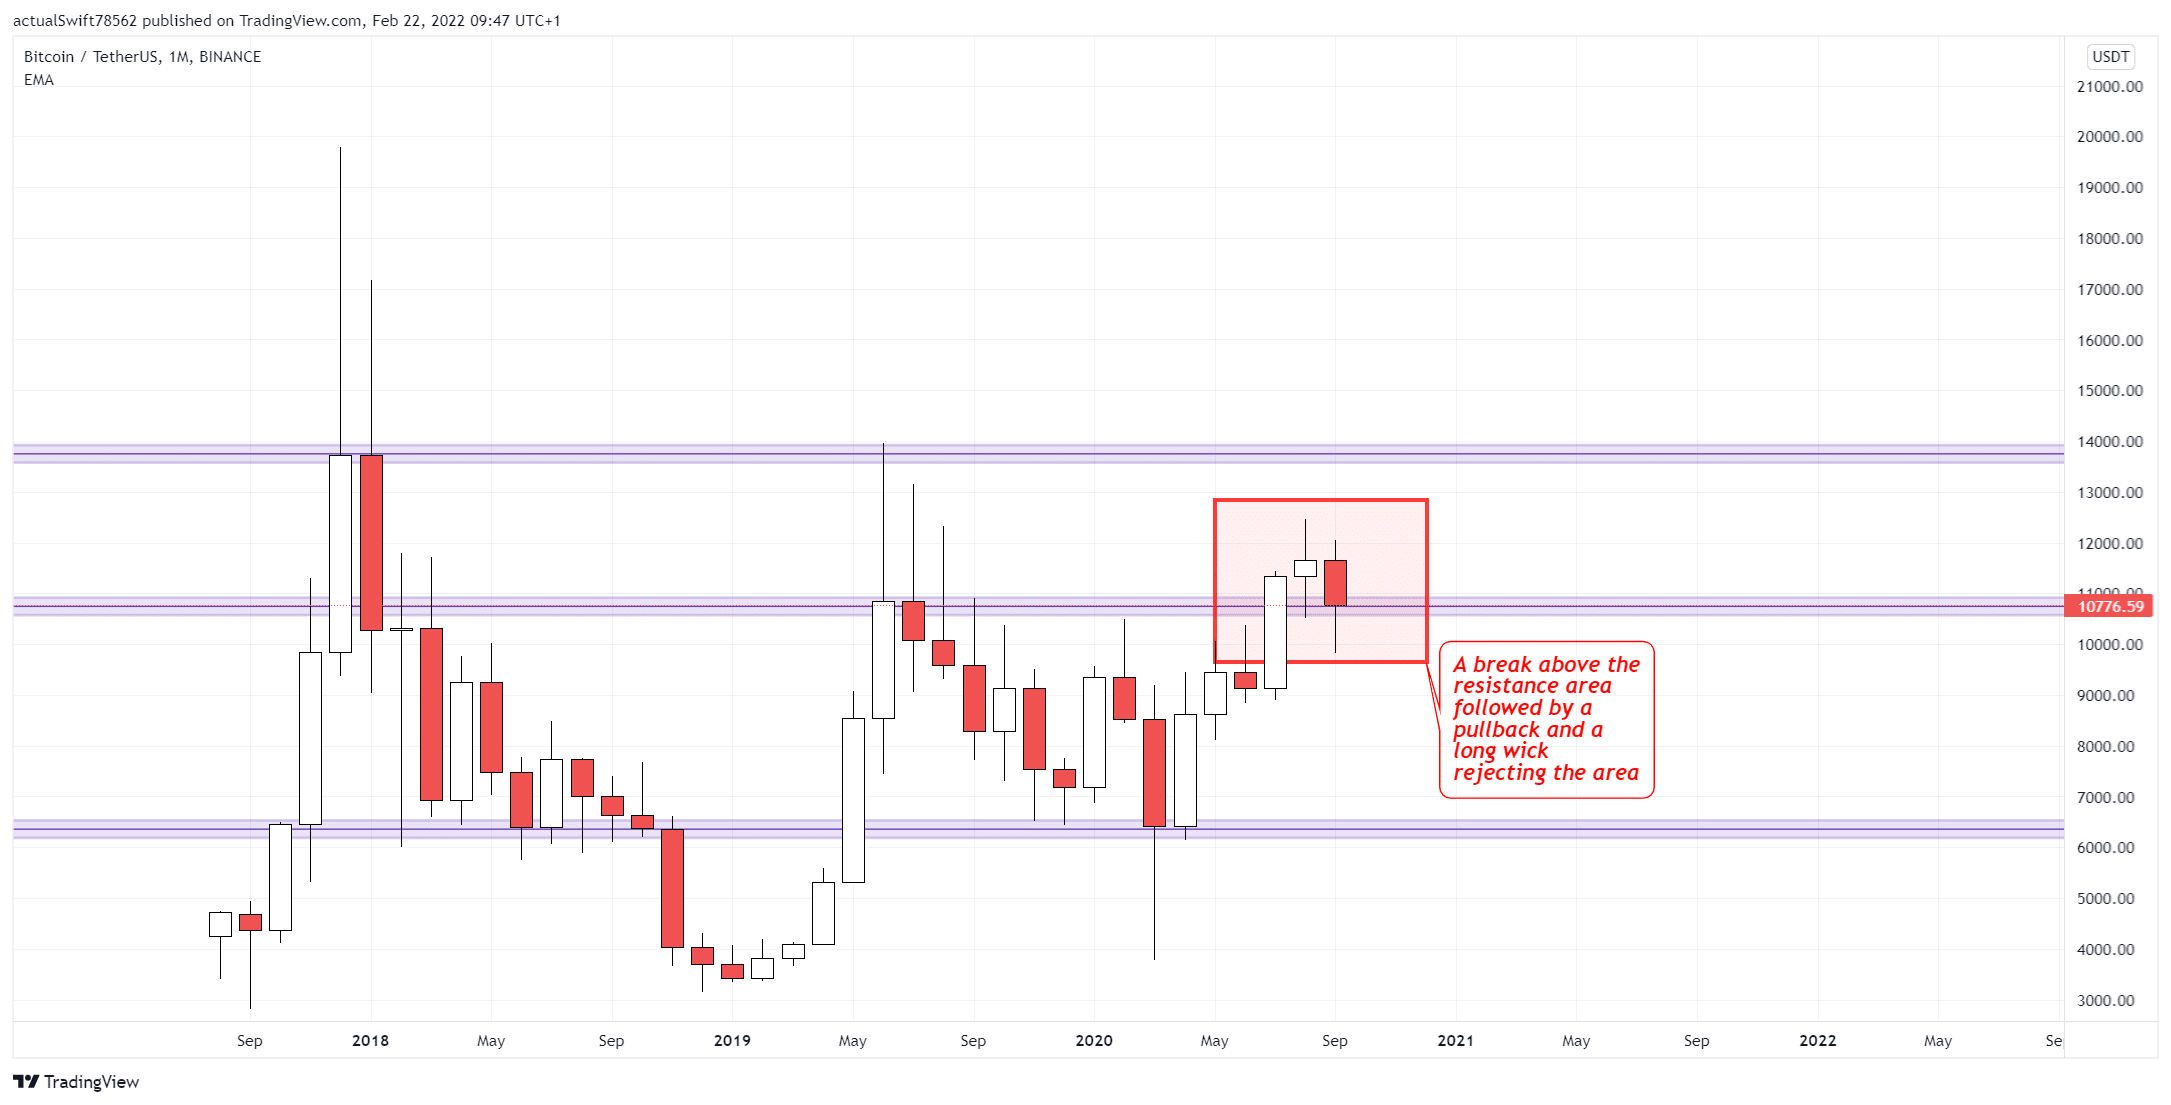
You are looking at the monthly chart of Bitcoin. On the monthly we saw the price break above a resistance area and then made a pullback back into the area. The price made a long wick rejecting the area, which caught our attention and we started looking for a trade.
Weekly Timeframe:
As per our strategy, we have to use timeframe confluence to confirm the bullish bias from the monthly time frame on the lower time frames. The whole point is to look for price action that would confirm that the pullback is ending.
We are looking for bullish price action on the weekly timeframe which we got through long wicks rejecting the S/R area. That confirmed our bullish bias on the weekly.
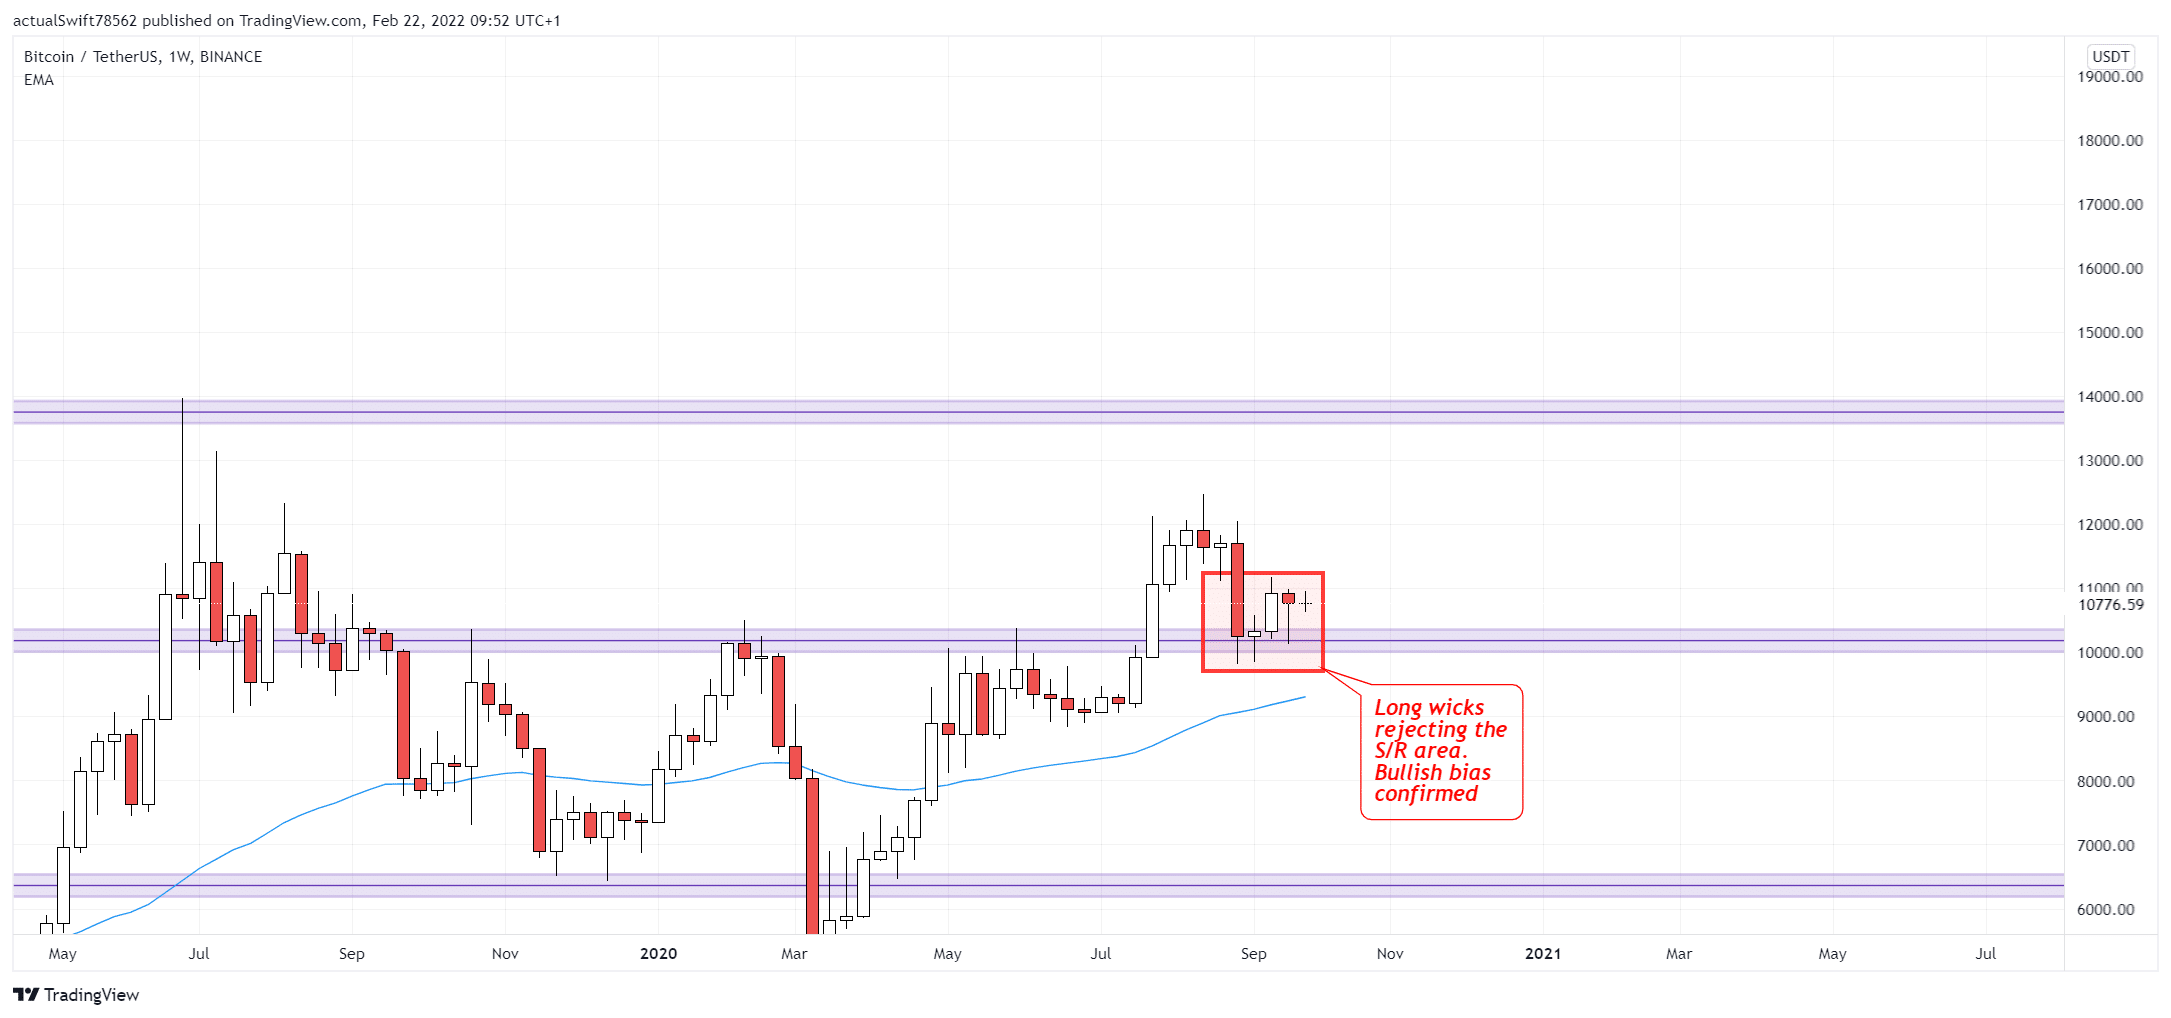
Next we have to confirm our timeframe confluence on the daily timeframe.
There, that was confirmed through a double bottom forming, which means the sellers can’t push the price lower anymore. Bullish bias confirmed.
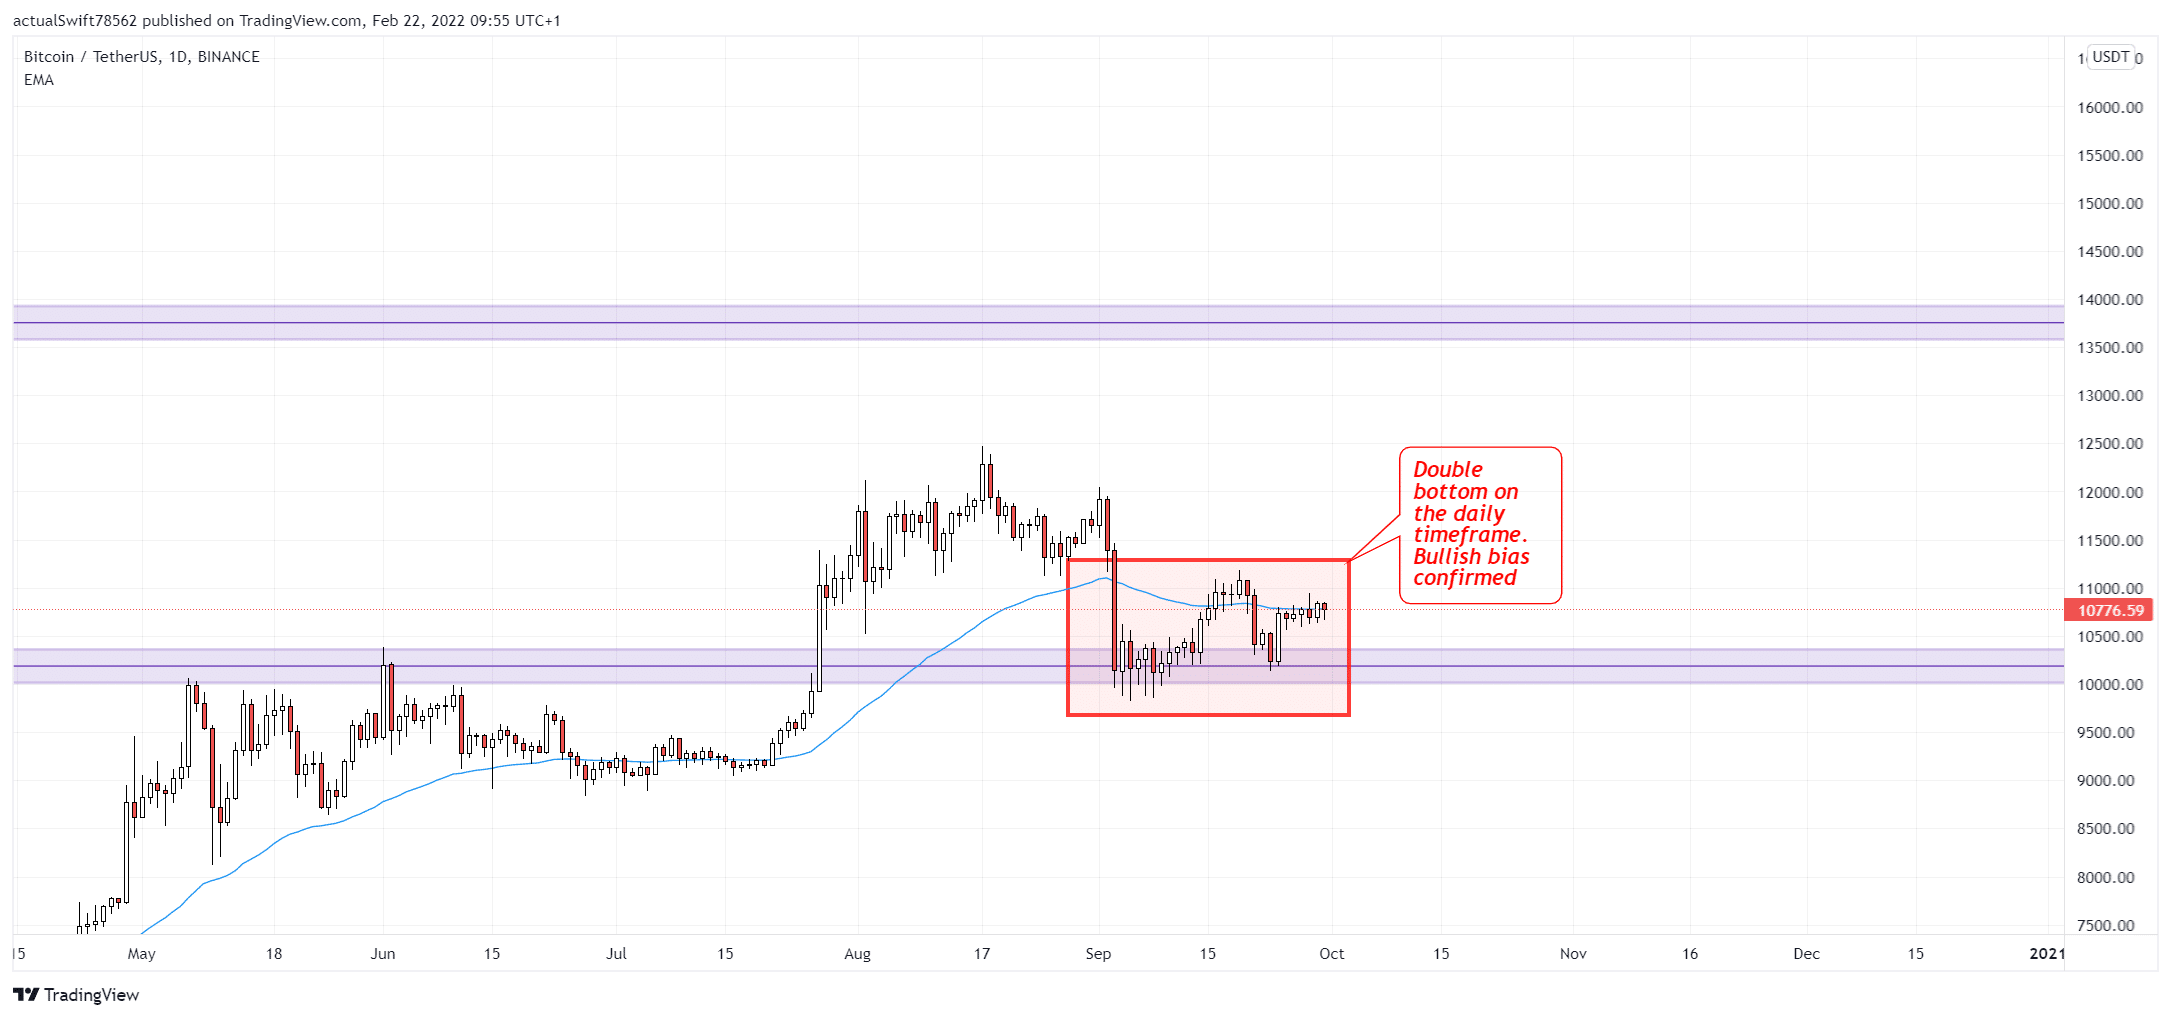
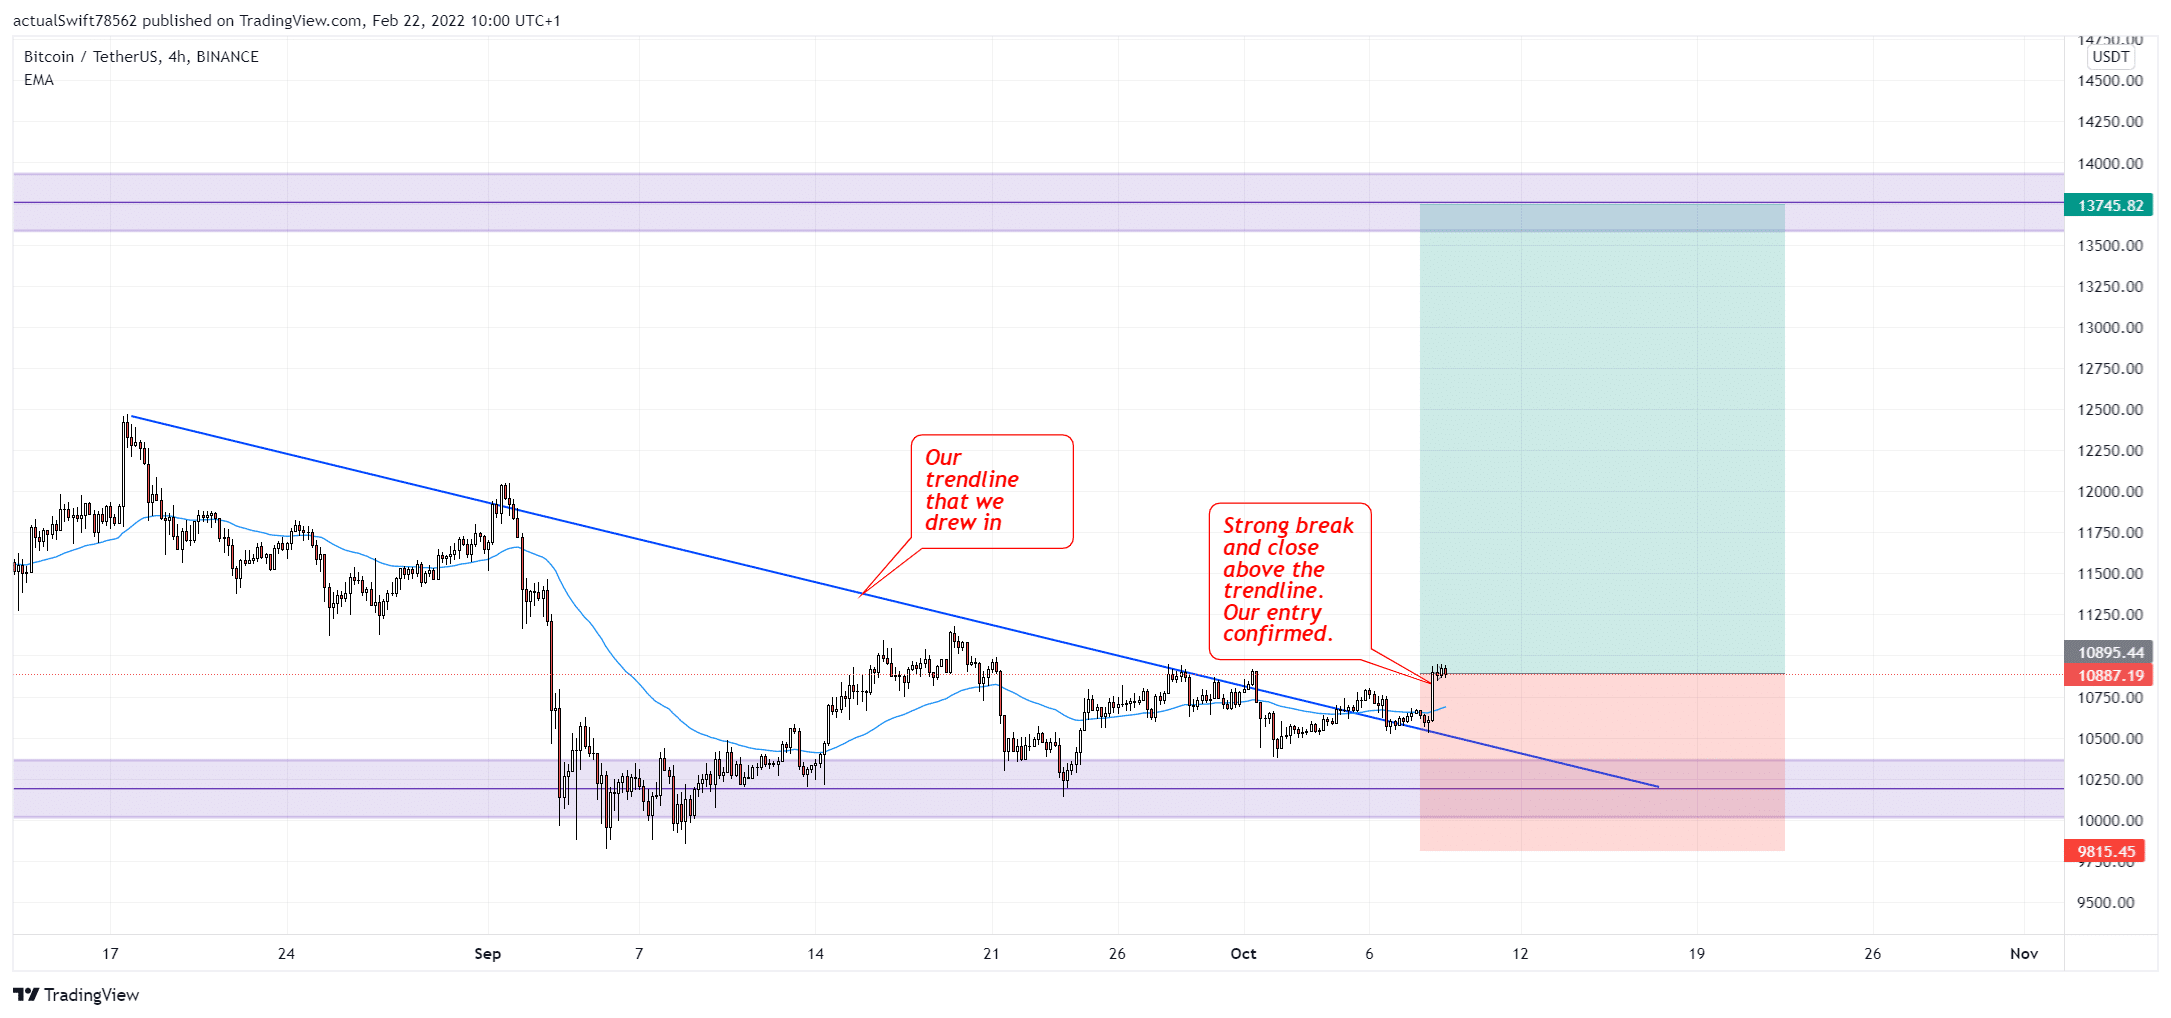
Our last step is the 4hour timeframe where we take our entries.
There, we drew in our trendline. If you remember, we said that our timeframe confluence and with that our entry is confirmed when we get a strong break and a close above the trendline.
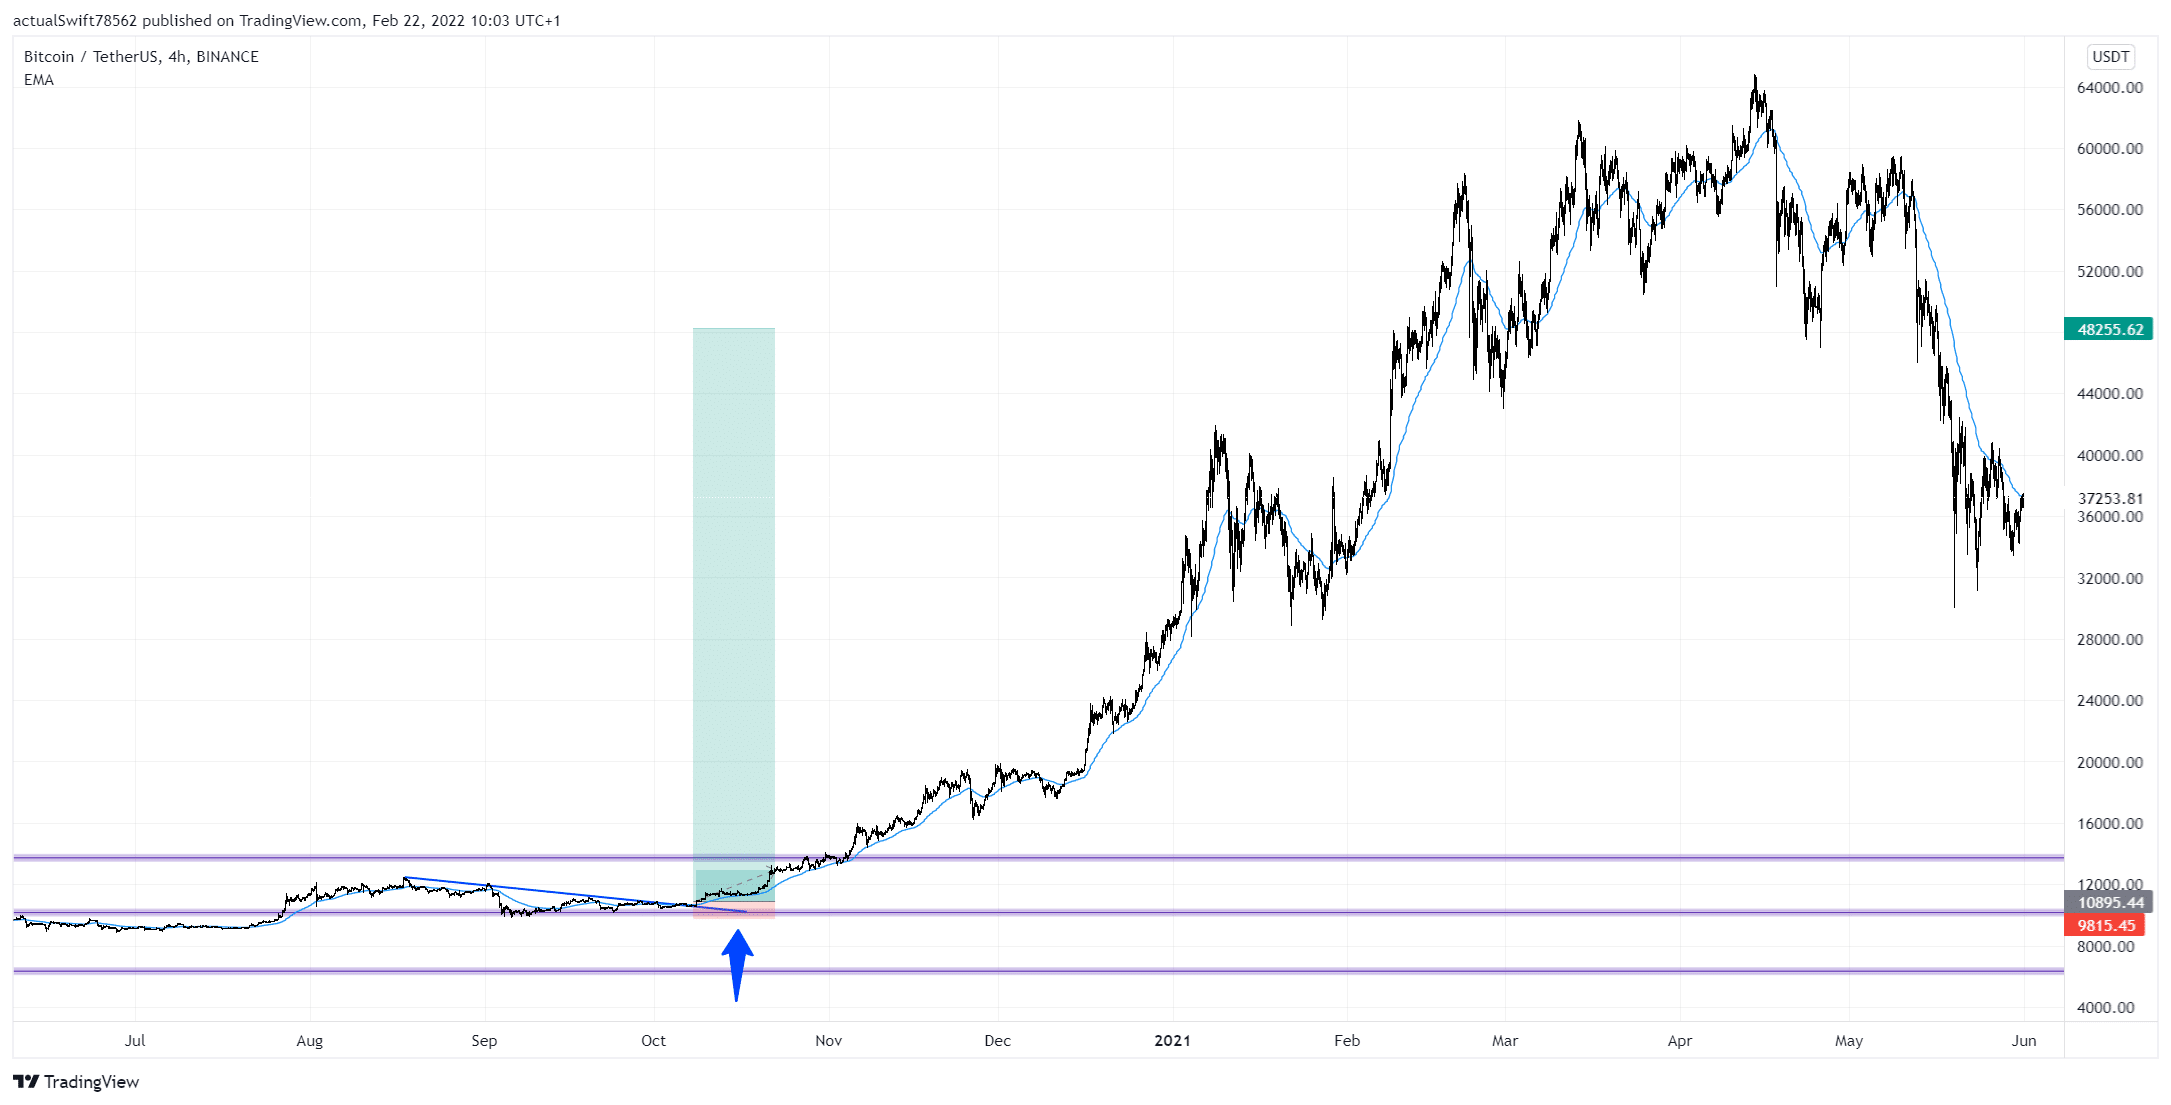
And that is exactly what happened. We got a strong break of the trendline and we entered the trade right on the candle close. Our stop loss went below the lows.
As you can see, this trade turned into a massive winner. We ended up closing this trade out with a 35:1 ratio.
Of course, not all trades are going to be like this, this was Crypto right at the beginning of the hype. But you can see what trades you can catch with this strategy.
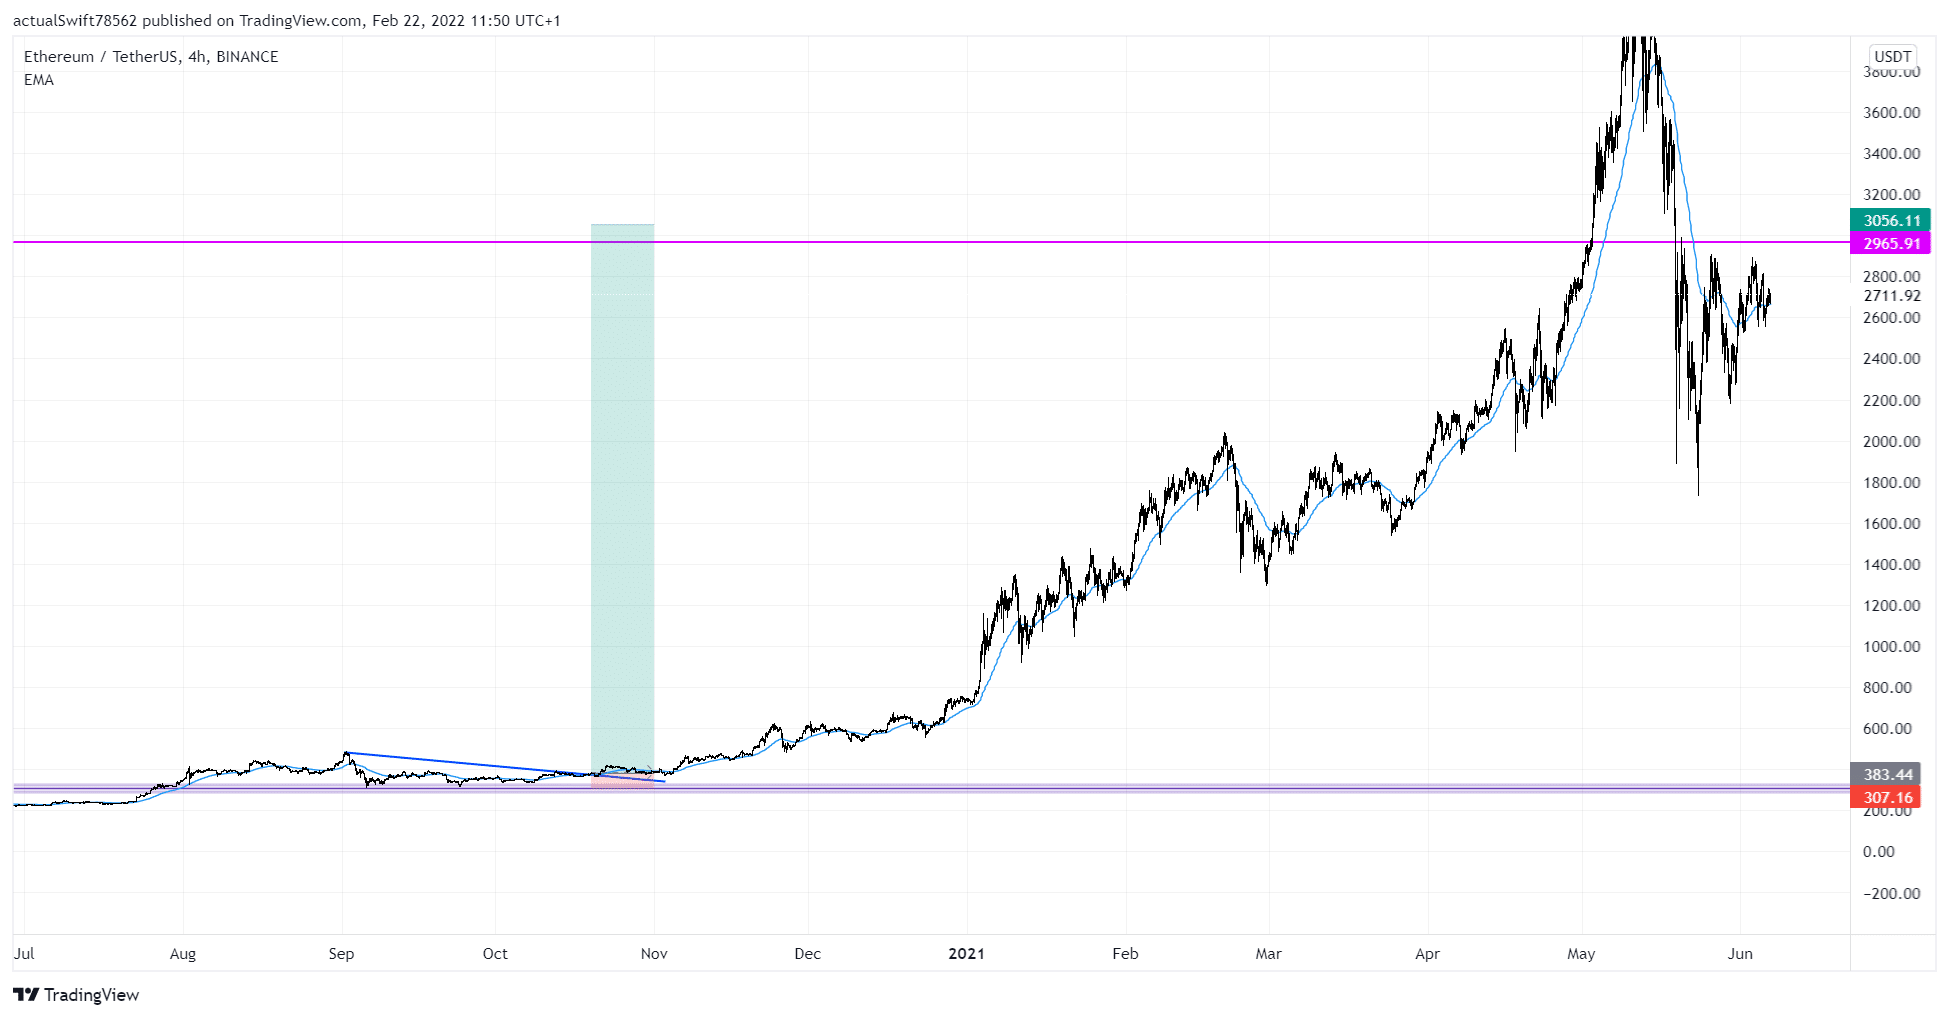
ETH/USDT:
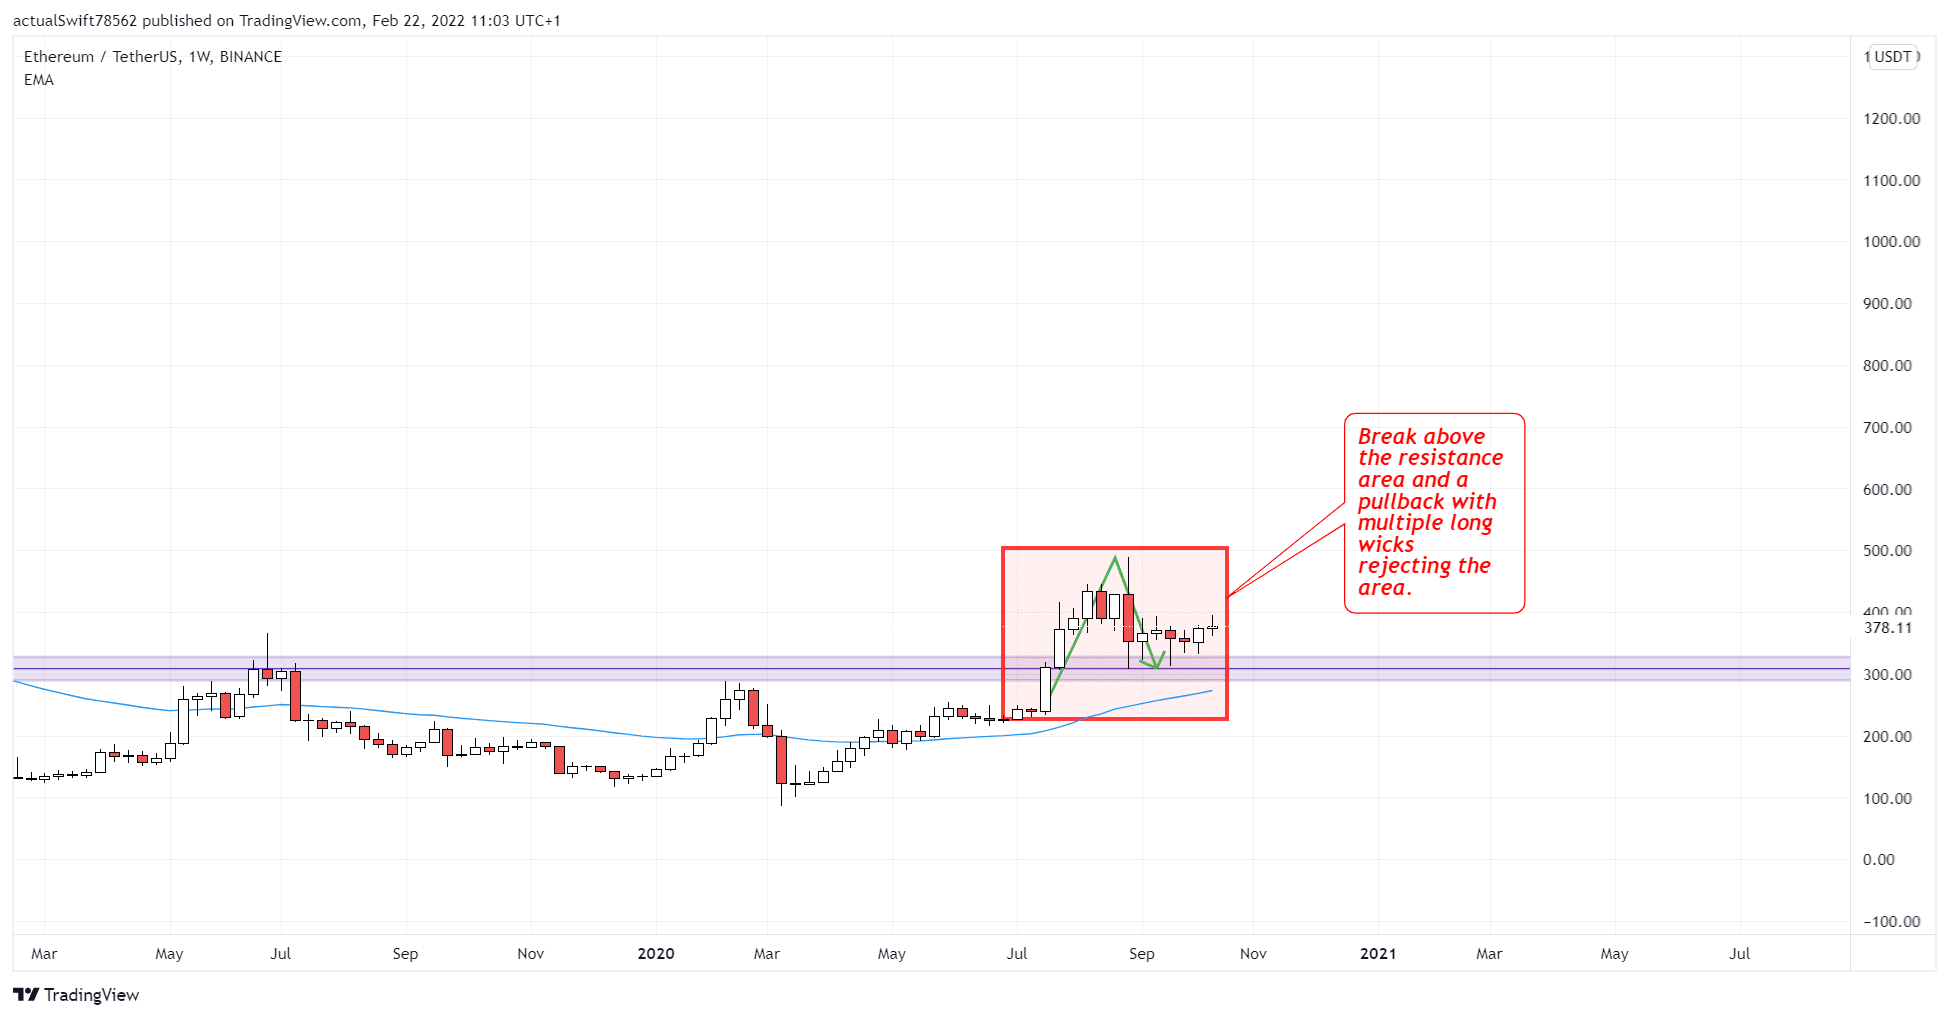
Our next example is going to be another Crypto pair. The story with this one is very similar to our Bitcoin trade, as all the bigger crypto pairs move similarly. Let’s get right into it.
We took this trade from the Weekly timeframe. We got a break of the resistance area and a pullback. There, we saw multiple long wicks rejecting the area. That gave us a potential trade on the weekly timeframe.
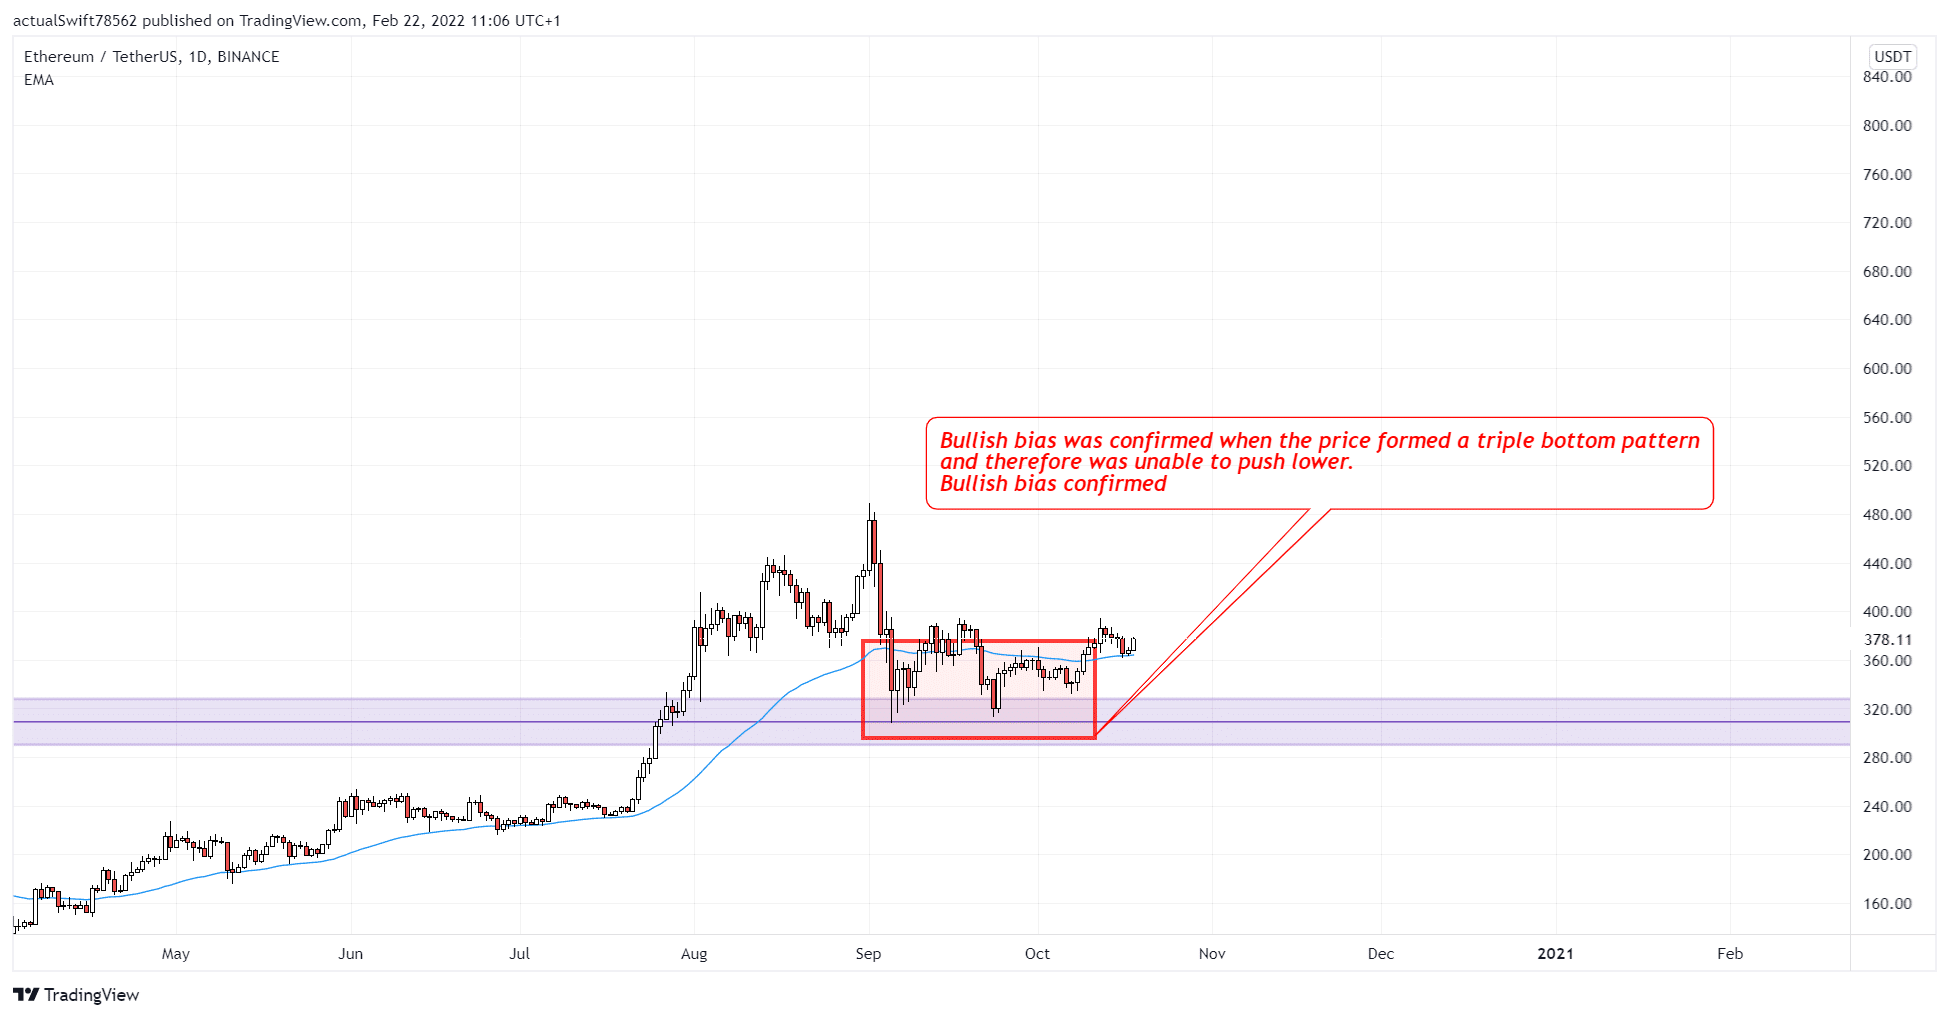
Next, we moved down to the Daily timeframe. There we looked to confirm the bullish bias from the weekly timeframe.
That bias was confirmed when the price formed a triple bottom pattern. That is a bullish pattern showing that bears are losing strength.
And finally, the last timeframe that we look at is the 4h timeframe where we take our entries.
We drew in a trendline and waited for the price to break and close above that trendline to confirm our timeframe confluence and with that, our entry.
As that happened we entered right on the breakout candle close. We placed our stop loss below the lows.
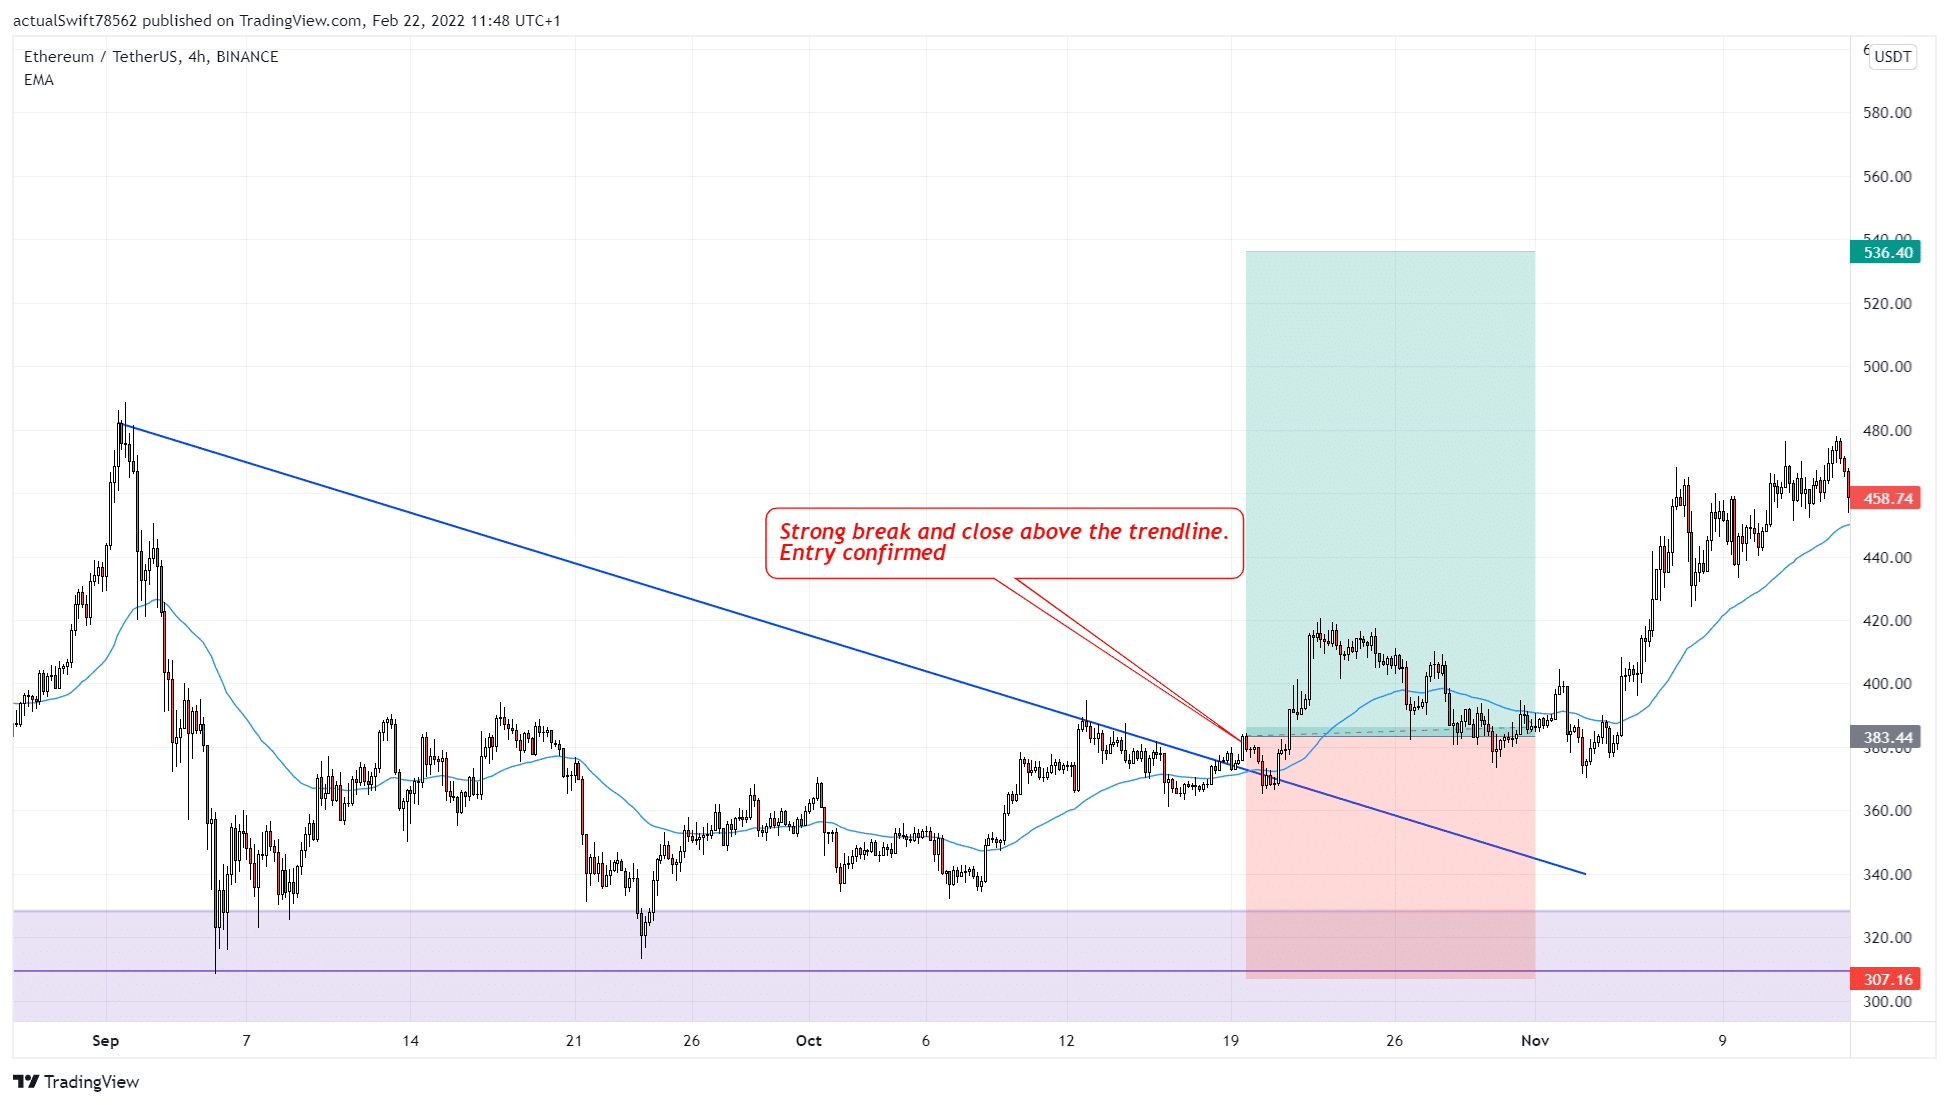
This turned into another monster trade thanks to the crypto hype. Of course, these two trades are cherry picked, not all the trades turn into such big winners. But as I’ve said before, it just goes to show that the strategy works in all markets.