Key Takeaways:
- Historical Significance: First developed in Japan during the eighteenth century by Munehisa Homma, candlestick charts have been popularized through the works of Steve Nison in relation to technical analysis in trading.
- Pattern Recognition: The candlestick patterns graphically depict the psychology underlying the market sentiments. A trader can view a number of chart formations that indicate bullish or bearish trends and reversals.
- Chart Interpretation: Developing an understanding of the candlestick body, the wicks, and the color coding will be important for analyzing market dynamics with a view to informing a trading decision.
What is a Candlestick Pattern in Trading?
The various candlestick patterns visible within the market have been playing a vital role for traders operating in stocks, currencies, and commodities. Japanese candlestick charts depict price action graphically, and investors can have an overview of the market sentiment right away. Recognizing the different trends allowed the trader to establish trends and possible reversals, so it was a key tool for lucrative trading strategies.
A Closer Look into History of Candlestick Charts
Candlestick charts originated in 18th-century Japan and represent one of the powerful tools in technical analysis. This innovative development in predicting the price movement in the rice market is attributed to a rice merchant named Munehisa Homma.
He was often referred to as the “God of Markets.” Much research was done by him on market psychology and on price action. He knew that by gauging a balance of fear, greed, and herd mentality, he would be able to anticipate market trends and create profitable trades.
From Japan to the World
Generally, the art of candlestick charting remained obscure outside Japan for many centuries until recent times in the late 20th century, when this worthy tool started to be appreciated all over the globe. Steve Nison is one of those who, from the limelight, created a strong basis for the popularity of candlestick charts in the Western world.
Nison’s pioneering books, one of them being “Japanese Candlestick Charting Techniques,” initially introduced the rich history and efficient use of candlestick patterns to Western traders. He took this mystical world of candlestick analysis and let the light in.
Evolution of Candlestick Chart
The charting of candlesticks has undergone evolution ever since the arrival of candlestick techniques in the West. The techniques were refined over time by traders and analysts. Many new trading strategies have been devised based on candlestick patterns.
This skill of reading candlestick charts has evolved into better trading platforms and software. Today, traders can use various technical indicators in seeing market trends and reversals: moving averages, Bollinger Bands, RSI.
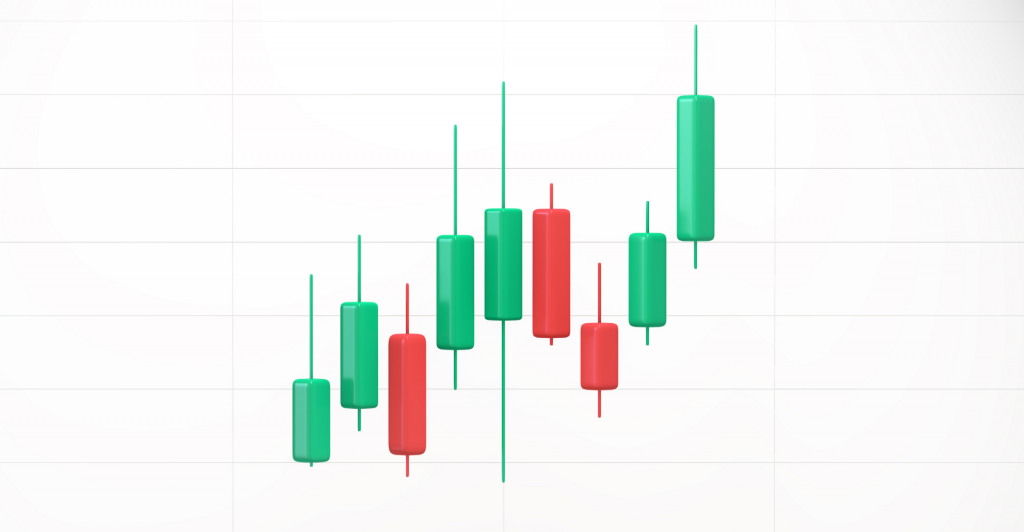
How to Read a Japanese Candlestick Chart
As with bar charts, a Japanese candlestick chart also is shown with four critical factors of an asset’s price over a given time frame:
- Open
- Close
- High
- Low
The horizontal baseline is time, and the vertical baseline is price. In charts depicting stocks, the one-day length of time is common, and one candlestick is drawn for that day. On Forex charts, once in a while, one candlestick is generated in a period as short as 15 or even 30 minutes.
Body of the Candlestick
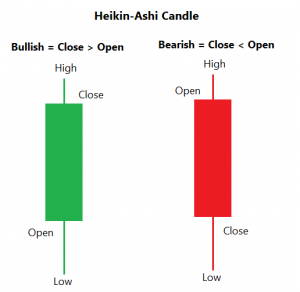
In Japanese candlestick charts, the body of each candlestick reflects the opening and closing prices of the asset:
- A long candlestick depicts a large difference between open and close,
- whereas a short candlestick signifies a small difference.
- A green or hollow/open candlestick indicates that the asset closed higher than it opened. In such a case, the opening price would then be at the bottom while the closing price is at the top.
- The opposite of this-a solid red candlestick – would represent that the asset closed lower than it opened. The opening price then is placed at the top while the closing price is placed at the bottom.
Candlestick Wicks
Like actual candles, Japanese candlesticks have “wicks” on either end. The upper wick indicates the high price that the security reached during the period; the lower wick indicates the low price. In instances when an upper or lower wick does not occur, it simply means that an open or close has also marked the high or low for that given time frame. Longer wicks tend to tell the investor how much more price volatility there was, and they can measure the range by subtracting the lowest price from the high.
What Candlestick Patterns Tell Investors
Japanese candlestick patterns are some of the powerful tools hedge funds use to make rapid, often lucrative trades against retail investors and traditional fund managers. The major candlestick formations can point toward the reversals or continuations of the trend in the market and allow a trader to fine-tune his strategy accordingly.
At a glance:
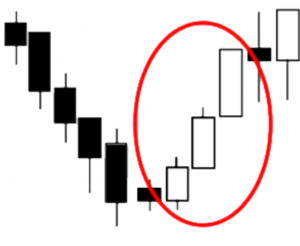
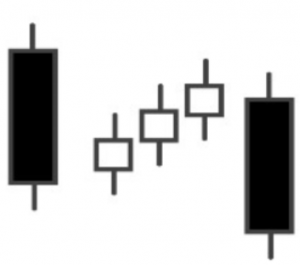
- A row of open, or green, candlesticks represents a bullish market and higher price action.
- A series of closed, or red, candlesticks represents a bearish market and lower price action.
- A small upper wick on a down candlestick reflects that the open was close to the high of the day.
- A small upper wick on an up candlestick reflects that the close was close to the high of the day.
The longer the candle shadow, the greater the volatility in the price of the asset.
Types of Bullish & Bearish Candlestick Patterns
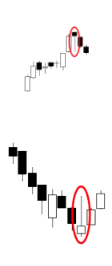
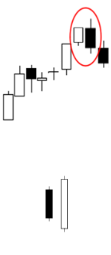
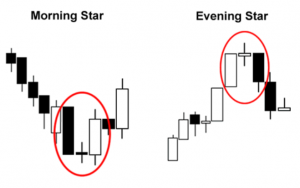
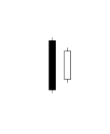
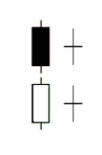
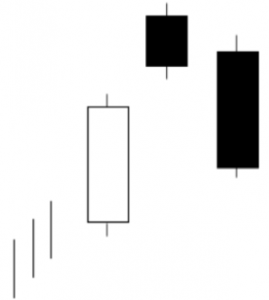
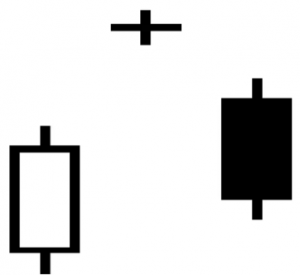
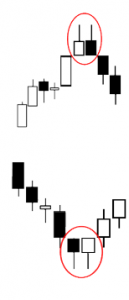
Of course, not every candle is created equal, and there are various types for a variety of purposes it serves in trade analysis. This type of candle will help the trader realize the proper market condition, especially when the trader is in need of trading candlestick patterns. Let’s explore the most prevalent Japanese candlestick patterns and their interpretation:
Identification of these bullish and bearish candle patterns is of immense importance to traders and much more so to traders specializing in candle pattern trading.
Candlestick Patterns: A Few Advantages They Bring to Trading
- Market Sentiment: That would tell a lot about the behavior of the other traders, that is highly useful in arriving at a buy or sell decision.
- Visual Clarity: Price action in candlestick charts is intuitively clearer visually than in conventional candle bar charts.
- Predictive Nature: The defined patterns indicative of the future price movement enable the trader to plan accordingly.
Limitations of Using Candlestick Patterns
Different traders might interpret the same pattern in their own light and reach completely different inferences so far as the direction of the market is concerned.
- Giving False Signals: Quite often, the patterns would give misleading signals, particularly when it came to those turbulent markets.
- Dependency on Context: In case one only were to have candlestick patterns and was not bothered looking at the market situations, then probably bad decisions in trading would ensue.
Japanese candlestick patterns give one a very strong premise with which one can understand the market and make calls in the flow of trading. Knowledge on how to read stock charts, together with the capability to interpret various types of candles and their patterns, forms the bedrock of an effective trader in the financial whirlpool.
Keeping that in mind, while one can be curious about what is the best candle pattern for scalping options, forex candlestick patterns, or specific insights into a bitcoin candlestick chart – stay tuned for upcoming blog posts, where we will provide more specific analyses of candlestick patterns and their meanings, helping you improve your trading strategies in real markets or during gamified trading competitions.







Comments are closed.