

Mean Reversion Trading is one of our most favorite types of trading setups at BullRush Academy.
Back in the volatile days of Forex, around 2008, reversal trades were our bread and butter setup. We perfected our use of them and they have remained in my trading arsenal ever since.
However, mastering mean reversion trading is not a walk in the park. It requires patience, analysis, some experience, and knowledge of your own trading strengths and weaknesses.
In this article, we want to help you take some leaps in using reversal trades in the best way possible.
We will take a thorough look at your entry, stop loss, and target.
But we are not just going to show you how to place them – We will help you understand why, so that you can independently trade reversals moving forward.
Keep a lookout at the end of the article where I give you some quick tips for reversal setups.
So, let’s dive straight in!
What is Mean Reversion Trading?
A mean reversion trading pattern is a setup that reverses the direction that price has recently been moving in, either up or down, until it reverts back to the mean. Here’s an example just to make it crystal clear:
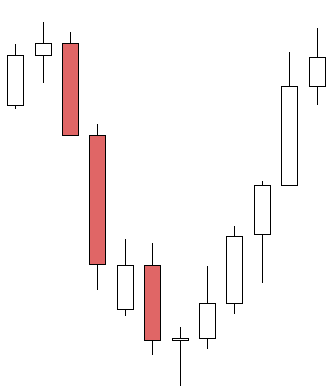
They are easy to spot and accessible to everyone, no matter the time frame or strategy.
With my forex price action trading strategy, reversals were my go-to setup for years. Around 2008, pairs were much more volatile and enabled me to practice and refine my technique and strategy for reversal setups.
The rules and parameters I now have in place for my reversals are the result of thousands of trades taken and piles of data that have been analyzed.
A lot of traders are cautious with mean reversion trading because they often go against a trend. But all trends eventually fail, and the resulting opportunities are simply too good to miss.
So, instead of simply showing you reversal trades, I am going to explain my thought process and method whilst also explaining why I apply the rules that I have when mean reversion trading.
My hope is that you will be able to independently trade reversals confidently and safely!
The Best Trade Parameters
In order to get the best trade parameters there are two things you first need to do.
You need to first ask yourself “Who is in control of price?”. It is a simple question, but essential. This is a question you need to ask yourself every step of the way when looking at potential reversal trades.
The second thing you need to do is look left. There is an entire history of price’s movement to the left of your screen – use it!
This will inform you on where the best placement for your trade parameters will be. Just remember though, recent data is king.
I am going to take a look at a very recent example in NZDUSD to highlight the reasons for my reversal setup methods – take a look:
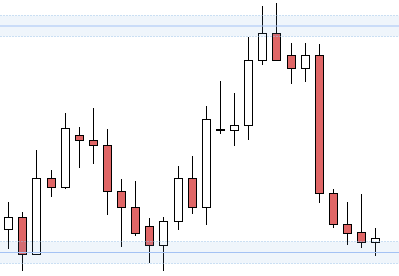
As you can see, on the right of the image we have an indecision candle forming on support. Let’s apply those two things I mentioned…
Who is in control of price? Well, bears have had strong control up until this most recent candle, where no one is in control of price. We have indecision.
Now, look left. You can see that price has reacted to this support area twice in recent weeks.
These two questions have alerted us to the fact that we could very well see a trade form here. Price is stalling on support, we have an indecision candle, and we have recent data to back up the fact that this area has seen reversals before.
Don’t make the mistake of thinking that this qualifies for entering a trade, though! We have a potential setup, but we do not have confirmation that price is going to reverse.
That brings us to the entry…
Entry
Your entry is the point at which you think price has reversed and is now a valid trade to enter.
Too many new traders do not think about their entry this way. They simply see a potential setup and jump in far too quickly.
You need to look for confirmation that the trade has reversed. This comes in the form of higher highs or lower lows.
I use this because it acts as an objective entry trigger that prevents you from trading out of greed or fear of missing out (FOMO). If you correctly apply entries, you will protect your capital and save yourself a lot of money.
So, how do we figure out where to put our entry?
Look left!
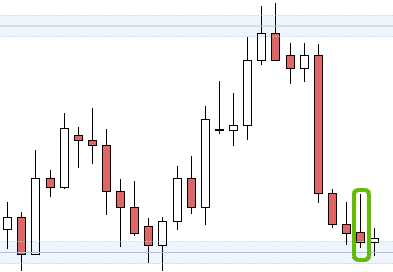
This candle has a long wick that shows bears pushing a bullish attempt back down.
This is our recent high that we are looking for price to break in order to trigger an entry.
It is actually quite a long wick that almost wipes this trade out by itself. But that is sometimes going to happen and it is common for traders to ignore this.
Confirmation that there is a change of who is in control of price is vital for reversal trades!
Notice that I don’t use the candles to the far left of the image. Recent data is king – this is especially true for your entry.
So we have established our entry, how about our stop loss?
Stop Loss
Your stop loss is the barrier that protects you from taking any unnecessary financial damage. It is one of the most important aspects of trading because protecting your capital is at the heart of trading forex.
I hope you know what your first step in placing your stop loss is…
Look left.
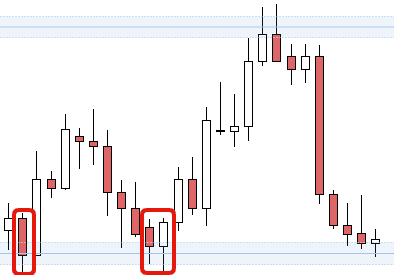
These are the two recent bounces from support and they inform us of where to place our stop loss.
People often make the mistake of using the current indecision candle as their only basis for placing a stop loss.
This is a mistake.
You have to get the whole picture – assess previous bounces and look for recent ones especially.
In this example, your stop loss should be placed below the wicks of the highlighted candles. This gives your trade a bit of room.
Price will not always just shoot up in the direction you want. You need to place your stop loss below this barrier.
This is where your risk-to-reward ratio will begin to creep into your mind. It is important to have a minimum RR for your trading in general so you have an objective point to base decisions from.
My minimum is 1.5 RR, so if my proposed parameters do not meet that requirement, I don’t enter the trade.
So, your stop loss needs to be below (or above if going short) the recent bounces from support as they inform you of where price struggles to push beyond. This is the wall that you place your own wall behind.
Target
Now, this is often the tricky part for many people.
External, subjective factors, such as greed or fear of trading, come into play. You may place your target too far or you could exit a trade well before it has run its course.
Don’t do these things – there is an objective way to place your target.
When you place your target, you should look to place it below the area it will likely find resistance. In our example, we have a major resistance area that is acting as that barrier.
I place it below this area because it decreases the risk of price turning around before hitting your TP. It is better to avoid placing your target at the same level that price turned around last time.
Have you had a trade turn around a few pips before your target? It is one of the most infuriating things to happen in trading.
Trading is about forex risk management, so do yourself a favor and apply it to your targets. Don’t let greed or fear dictate your decisions!
Once again, we need to look left to inform our decisions. We need to zoom out a little further to see recent data for this one:
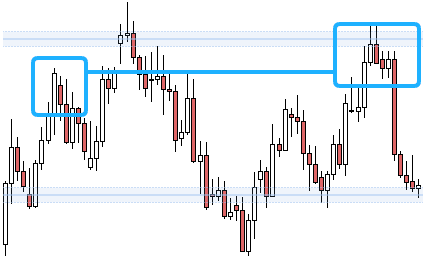
The two highlighted areas show the most recent bounce from resistance as well as a bounce that didn’t quite make it to the resistance area.
That bounce which didn’t quite make it – that is what you should be concerned about. If that happens again, only for your target to be up at the resistance area – well, you won’t have a successful trade.
You could hope that price pushes up again, like it did, but relying on that is simply gambling.
The line connecting the two highlighted areas also shows you that this is an area that price struggles with.
There are indecision candles, sideways movement, and bounces all along this area. This should indicate to you that this is a wall that you may want to place your target below, or else risk price reacting to it and never hitting your TP.
The Trade Itself
When it comes to the trade itself, you will have slightly different trade parameters than me, or anyone else. But following the methods for each parameter, you will find yourself in a very similar place.
You may enter a bit before me, or maybe your stop loss has a bit more breathing room. You could even have different minimum RR requirements that mean you don’t take the trade.
These things are all good and are part of developing your own trading style. I take a lot less trades than most of my students because I don’t need to take as many trades and put a particular focus on taking on as little risk as possible.
So, let’s take a look at what happened with this trade. I used TradingView’s short position tool to highlight all three of my trade parameters:
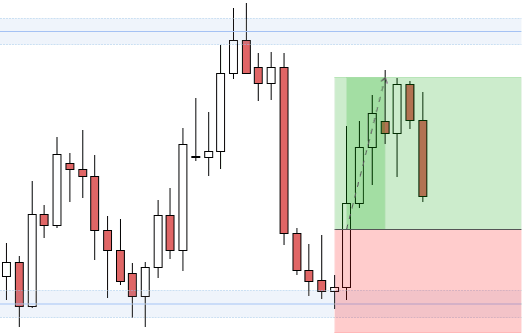
As you can see, the trade pushed quite strongly on the very next candle. This highlights a point I want to make.
Being prepared for a potential trade is going to mean you miss very few trades.
Pending orders can be great for this if you are short on time.
My stop loss didn’t get tested. In this trade, the stop loss was actually a little tighter than I prefer. However, I was still able to place it behind those candles and maintain my 1.5 RR.
Lastly, you can see that my TP was conservative – and for good reason.
The same bounce that I highlighted earlier did in fact happen again. A greedier trader would be in a tough spot right now, with price pushing against them.
I could have extended my target to around 1.9 RR if I had gone to the resistance area.
But this is why I use the methods that I have created over the last decade. Using objective data will always trump subjective opinion when it comes to placing your trade parameters.
With mean reversion trading it is that much more important.
Tips & Tricks for Reversals
That wraps it up for the mean reversion trading profile. I wanted to leave you with some handy tips and tricks for reversal setups that you can use going forward!
- Always scroll through multiple time frames when looking at reversals. This will help you in placing trade parameters as well as getting the full story of price.
- Ranges are some of the best types of reversal trades you can find. These are high probability and can be lucrative.
- If you see pairs that are trending strongly, keep an eye on them when they come to SR areas. All trends end eventually – the longer they go, the likelier it is they will reverse at the next SR.
- Wait for confirmation before entering a trade. Patience in trading is difficult to master but practice makes perfect!
Feel free to leave any comments or questions below and I will be happy to answer them.
Happy trading!
Comments are closed.