

Lesson 5.1: Main timeframe
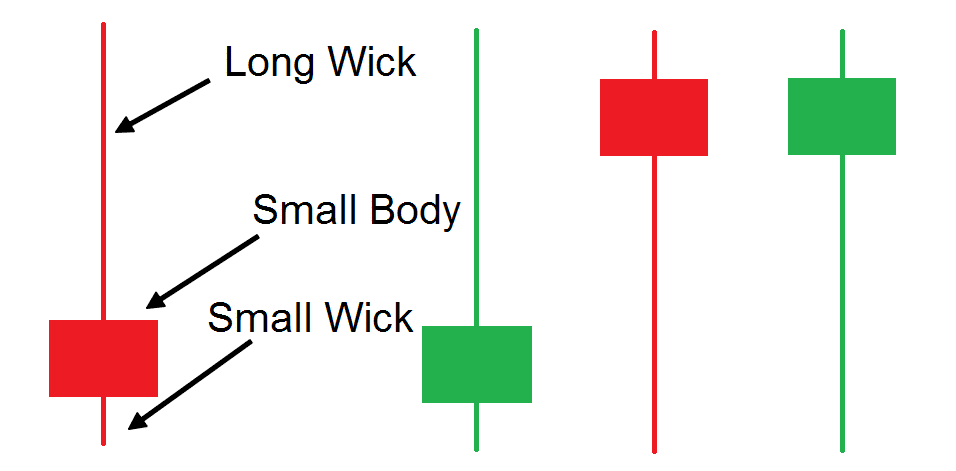
On the main timeframe, we look only for candlestick patterns on S/R areas. More specifically, we look for long wick candles rejecting the S/R area.
We like to trade with the trend, so we want price action in the trend’s direction.
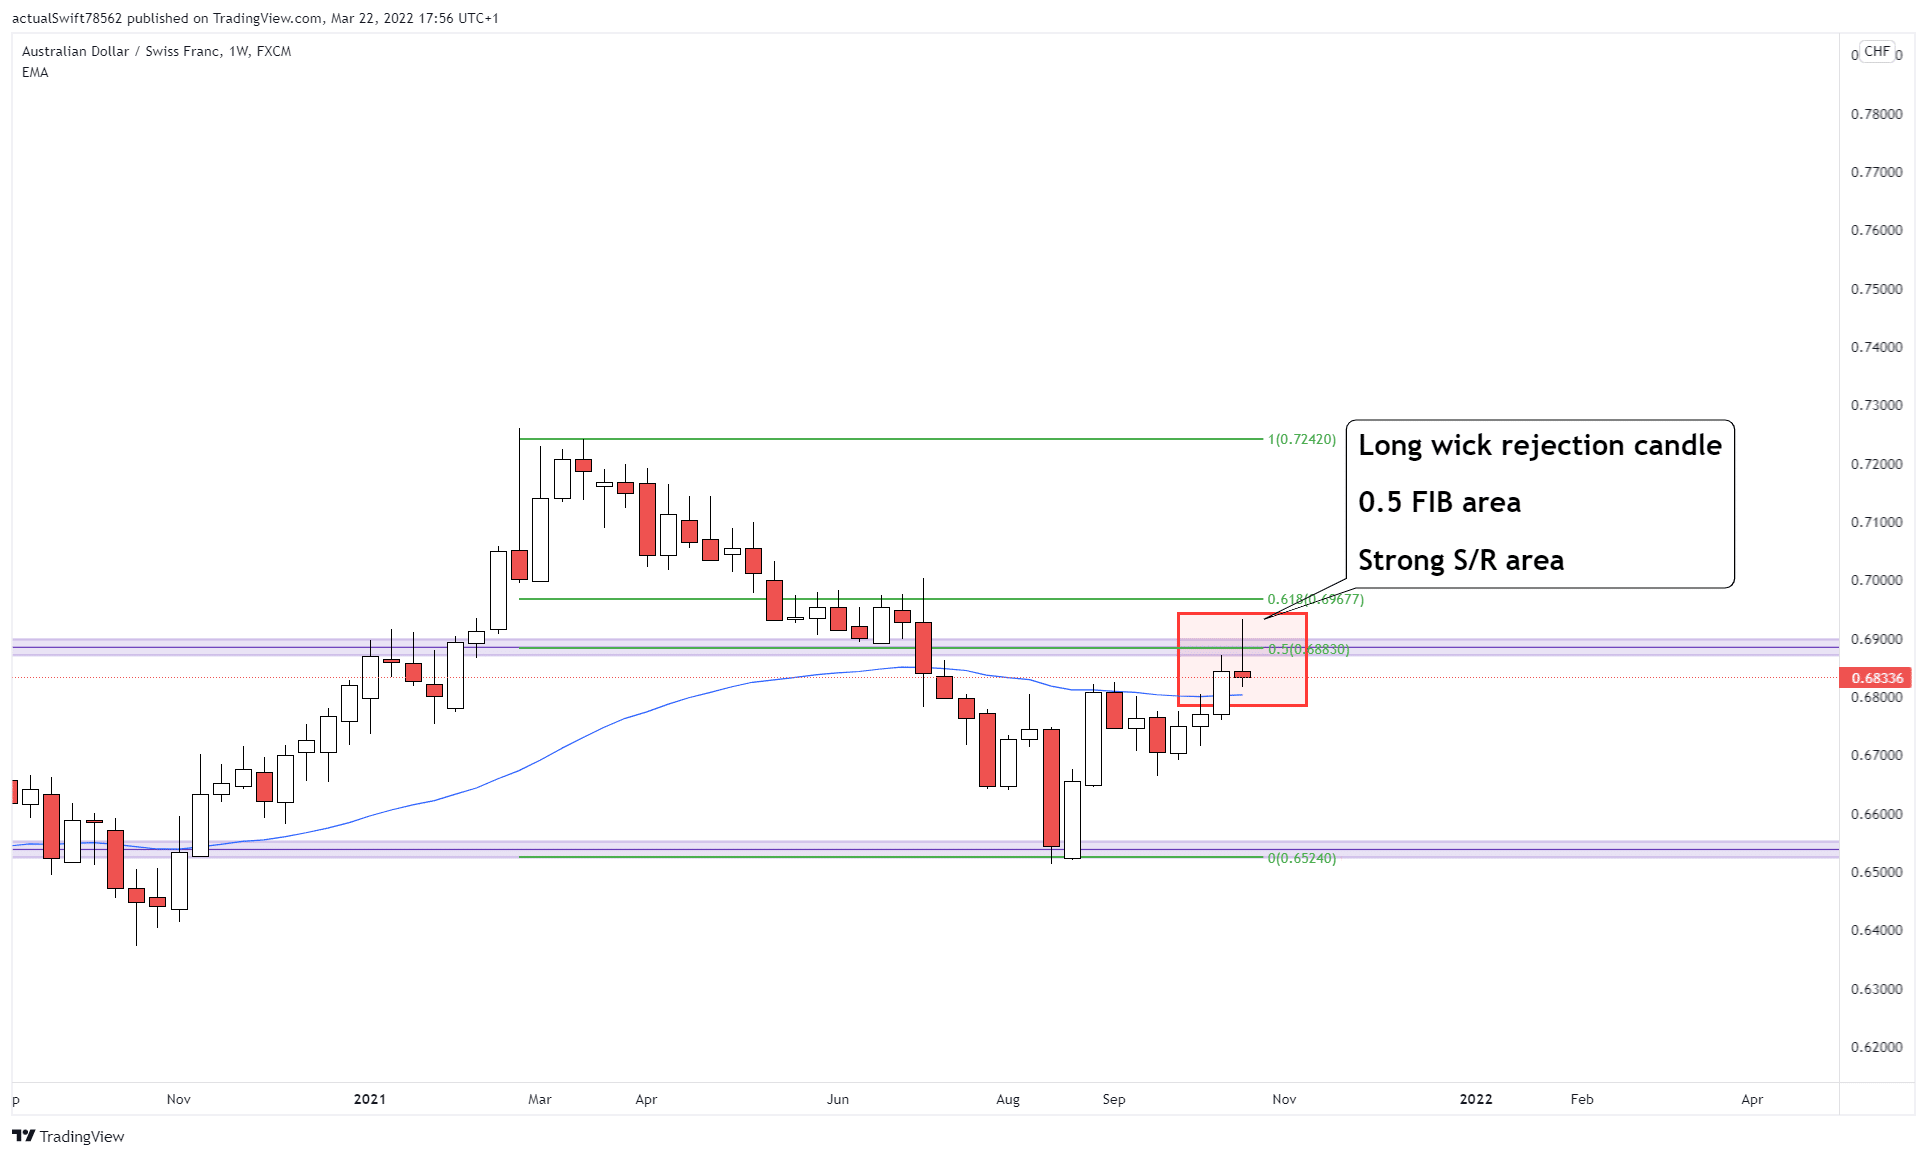
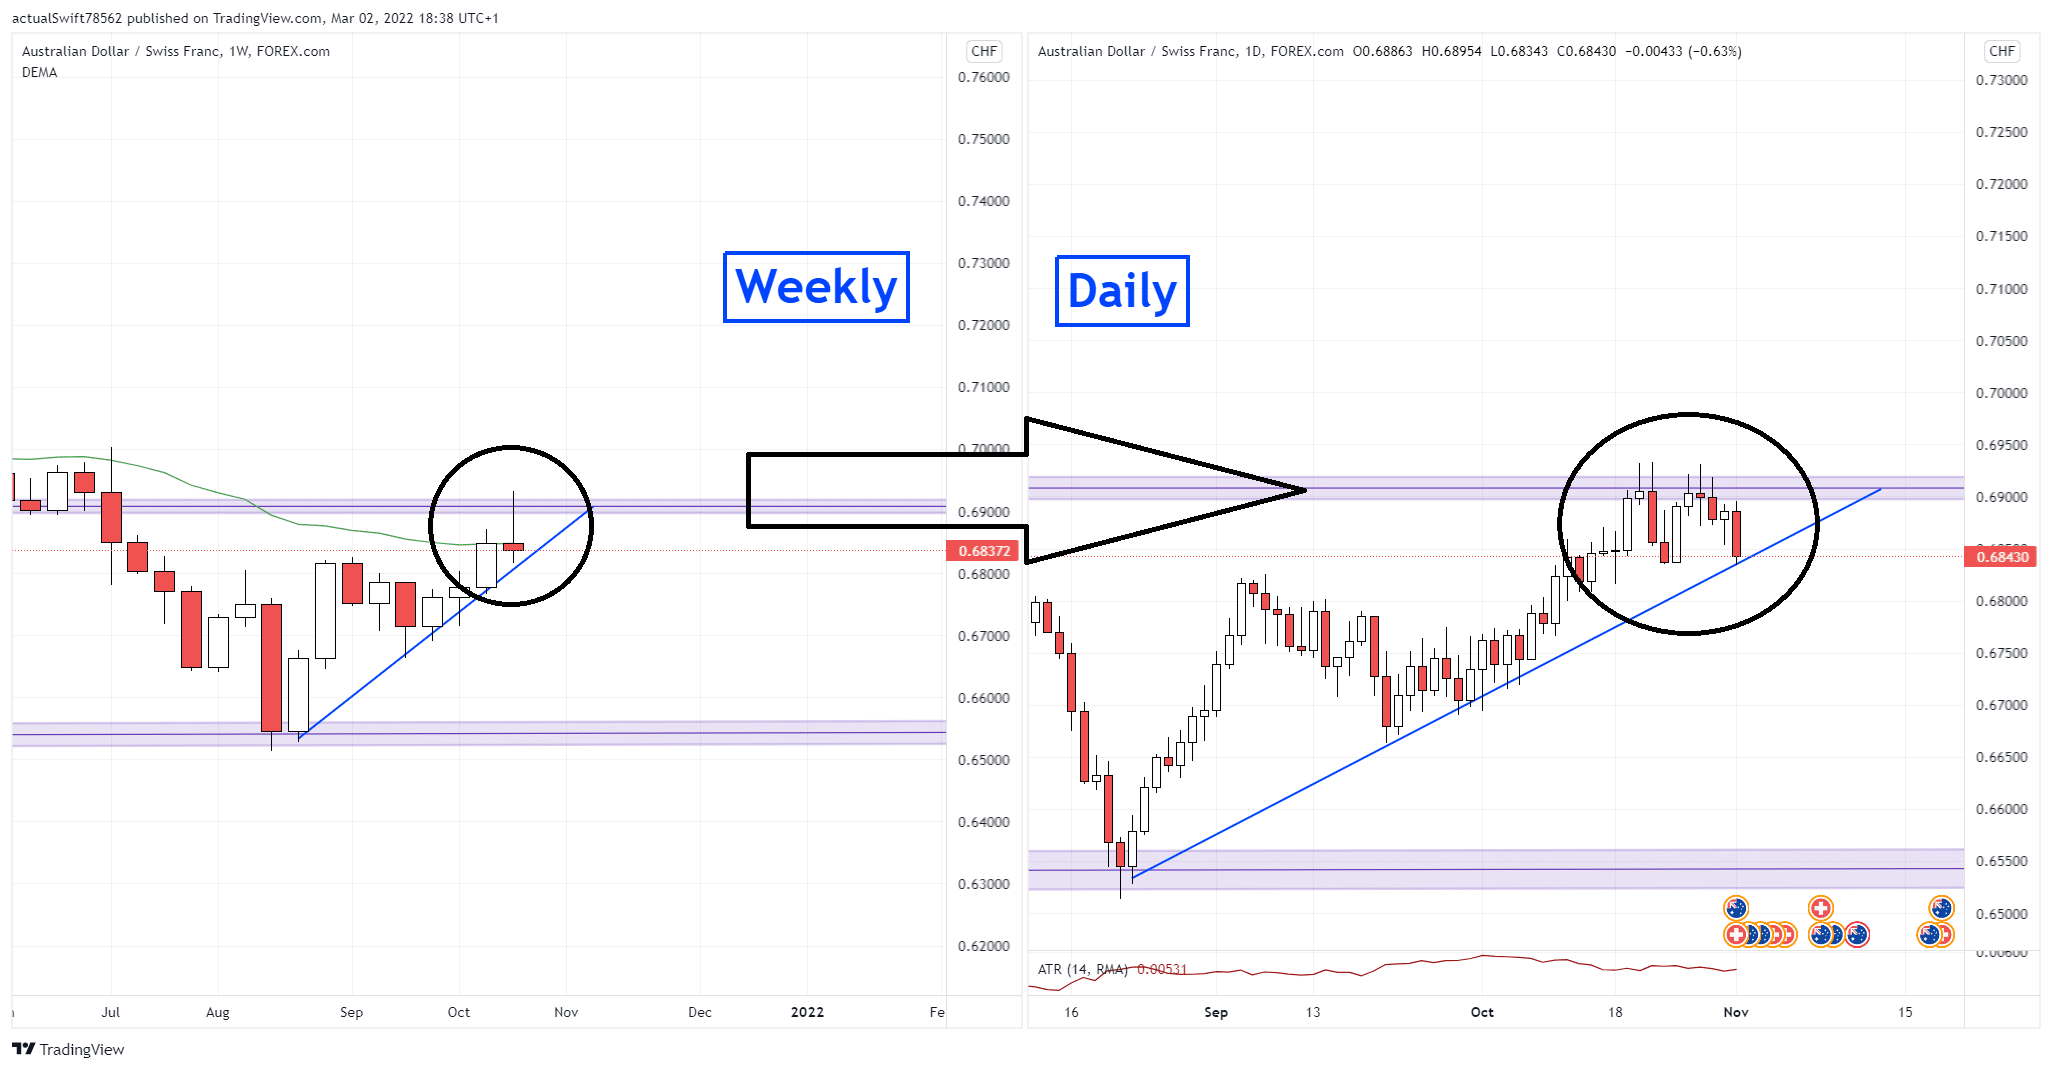
Let’s look at this weekly chart of AUD/CHF;
This is our main timeframe where we spotted the setup.
We see that the price has made a pullback back into a very strong weekly S/R area. That area also aligned with the 0.5 FIB level, which made for a great area to trade from.
Once the price formed a long wick rejection candle on that area, it gave us a great potential setup.
Lesson 5.2: Lower time frames
On the lower time frame, we no longer look for candlestick patterns. They aren’t important here anymore. Individual candles aren’t reliable compared to the higher timeframe, instead, we look at the bigger picture.
If we want to confirm a bullish bias we’ll look for signs that the current short-term downtrend (Pullback) is ending.
And if we want to confirm a short bias, we want to see that the current short-term uptrend (pullback) is ending.
Here is what we look for:
Trend Structure
Double Top/Bottom
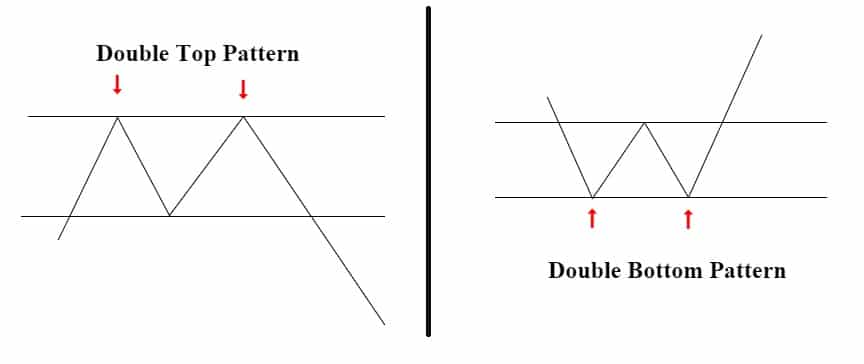
If we want to confirm a short bias, we look for a double top pattern in an uptrend.
And if we want to confirm a long bias, we look for a double bottom pattern in a downtrend.
Those are both patterns that show loss of strength and a potential trend reversal.
Lower Low/Higher High
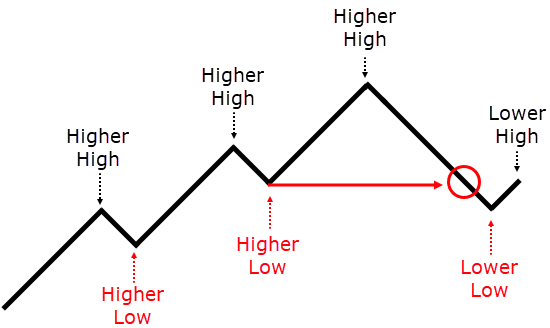
Note that we only look for one of them. We do not need both the Double Top/Bottom pattern and a Lower Low/Higher High. One is enough to confirm our time frame confluence.
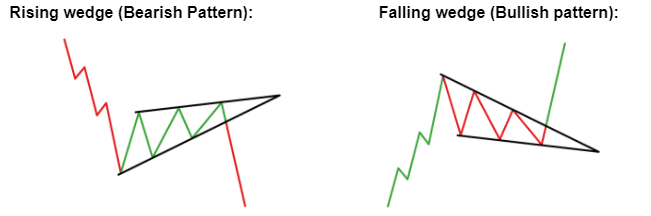
Wedge Pattern
If we see a wedge pattern forming we don’t need to look for any double tops/bottoms or higher highs or lower lows. If there is a wedge pattern, our timeframe confluence is confirmed. On top of that, if we see the pattern on one timeframe, it’s also gonna appear on all the other timeframes, because that’s how patterns work.
Back to our AUD/CHF example:
When we trade from the weekly timeframe, our first lower timeframe that we look at is the daily.
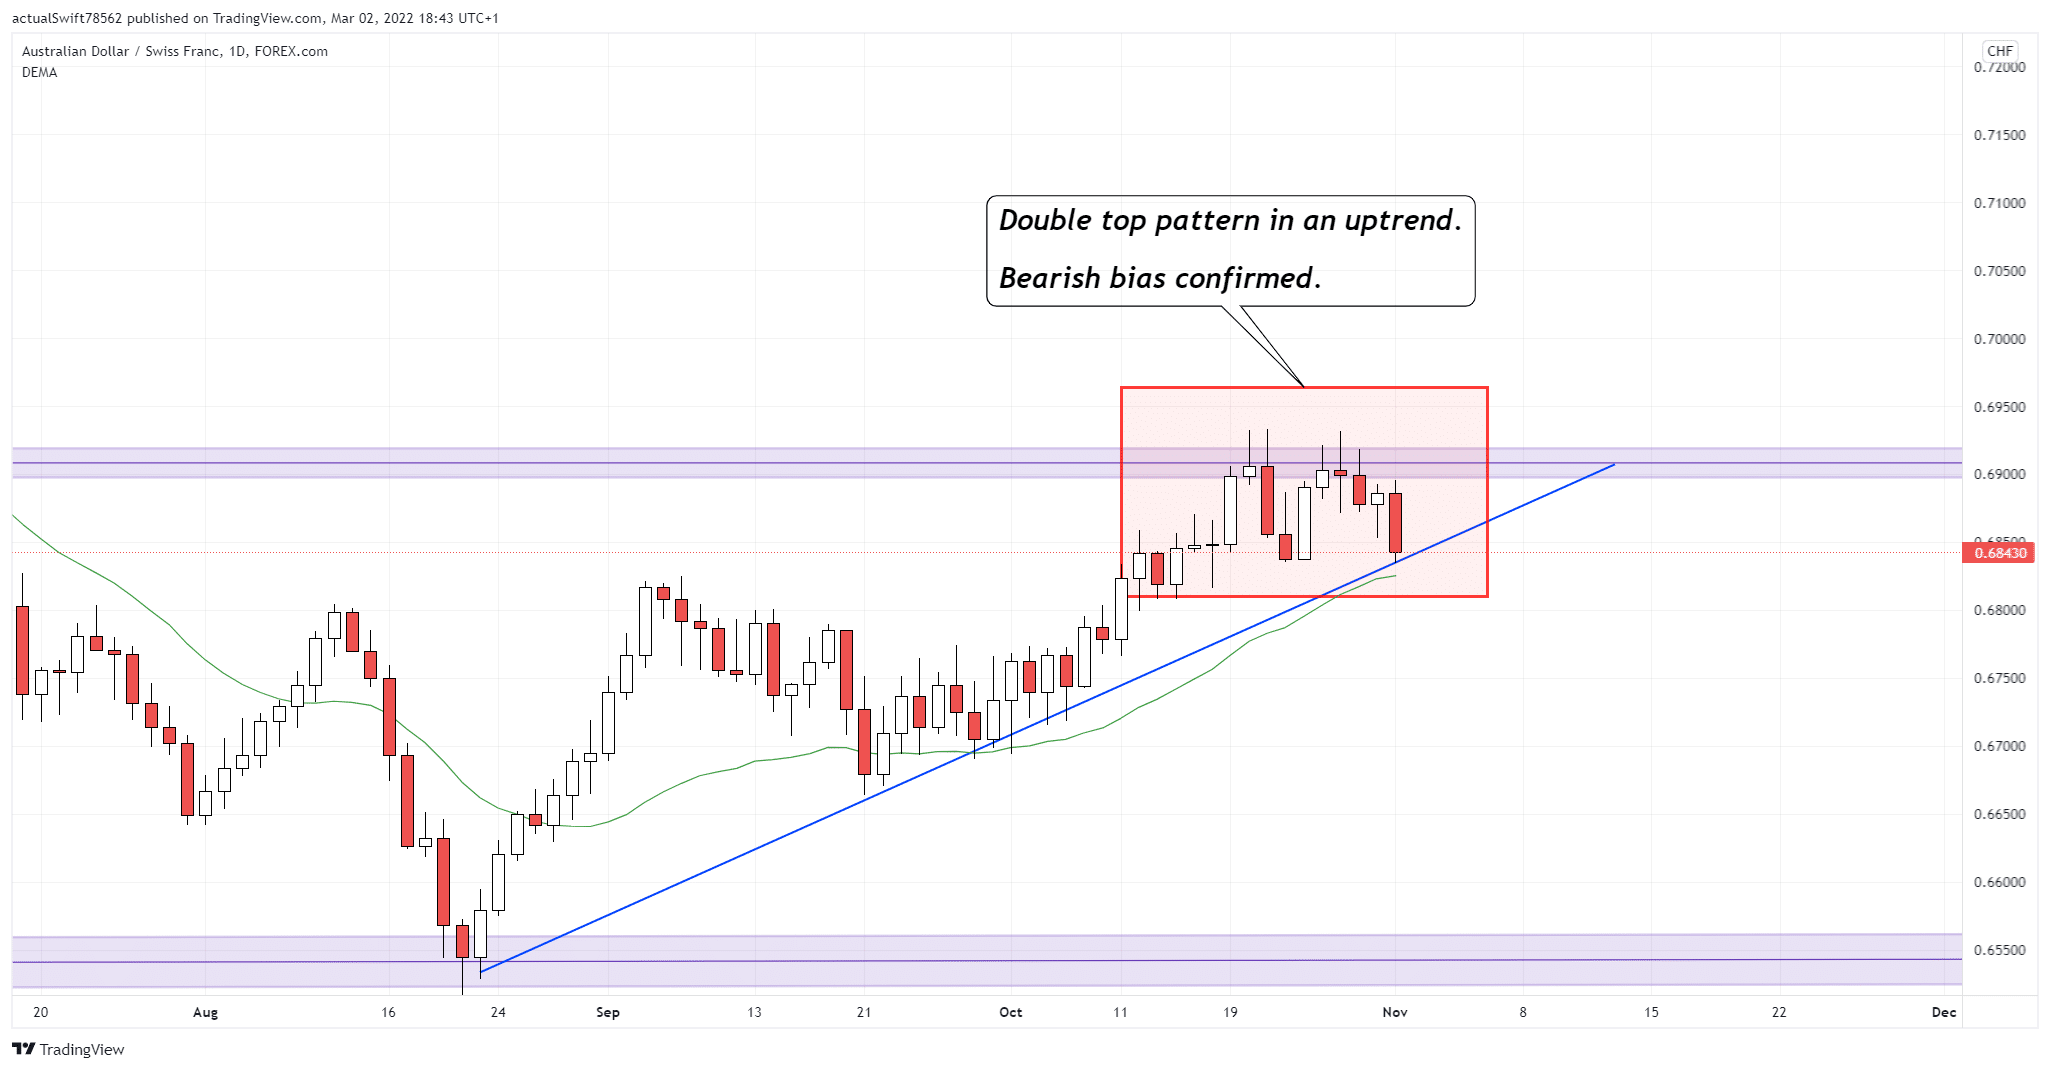
Here on the daily, our timeframe confluence was confirmed through this double top pattern. That shows us that bulls are losing control and can no longer push the price higher.
At the same time, it means that the bears are stepping in and therefore we have a bearish bias on the daily timeframe as well.
The next and the last timeframe and also the timeframe that we take our entry form is the 4h timeframe.
We will cover what to look at on the 4h timeframe when we get to our entry strategy, as they are very closely connected.