

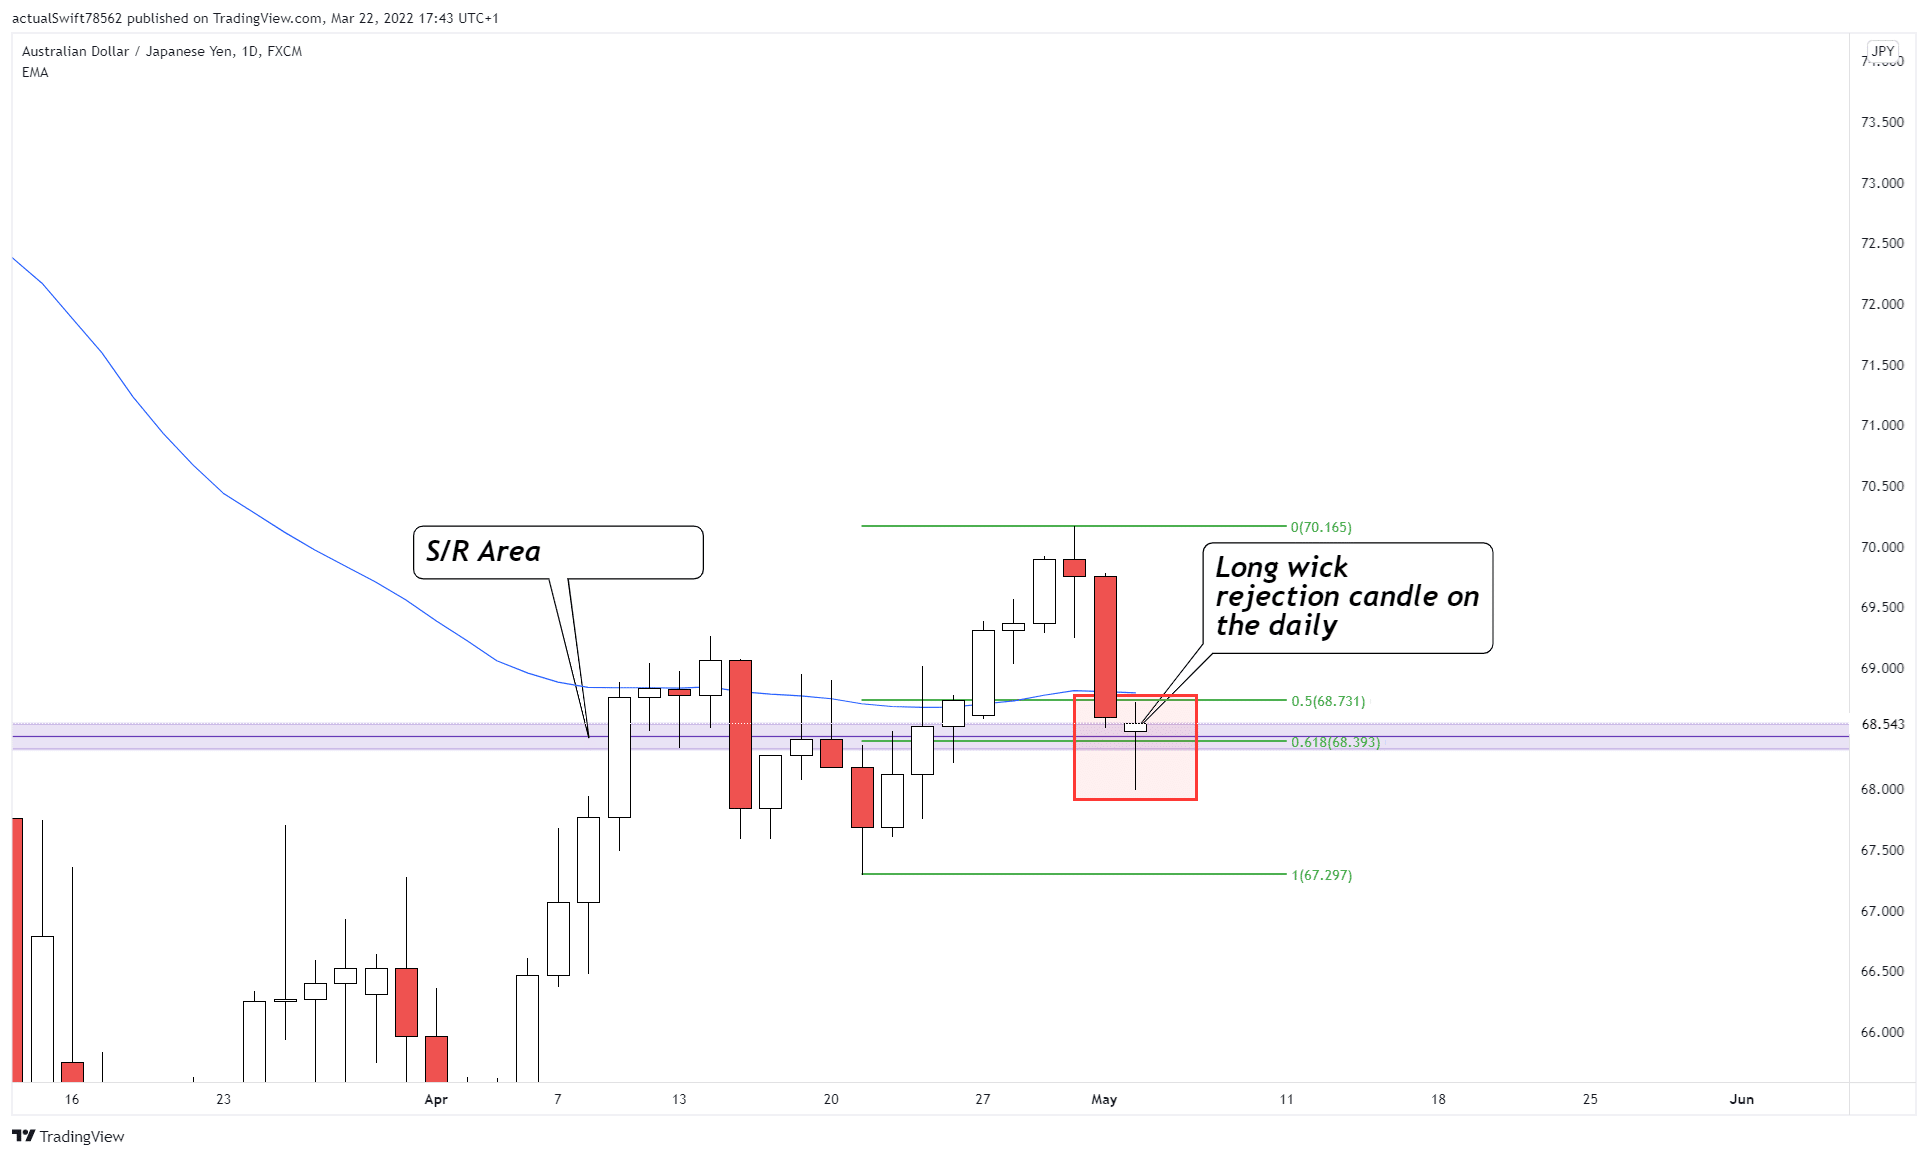
We’ll use AUD/JPY Daily as an example.
We saw a great bullish rejection candle form on the daily chart which tricked many people into entering a trade long.
It looked like a perfect trade; the price is in an uptrend. We had a break of the resistance area and a perfect retrace with a bullish rejection candle, and on top of all that, the price also aligned with the 61,8 Fibonacci area. A fantastic setup for a trade long.
The story was completely different on the 4-hour time frame. The price wasn’t rejecting the support area, but instead, it broke the area and that rejection candle that we saw on the daily chart was just a retrace back into the support area that turned resistance. Our daily chart presented a potential long trade, but our 4-hour chart is telling us to go short.
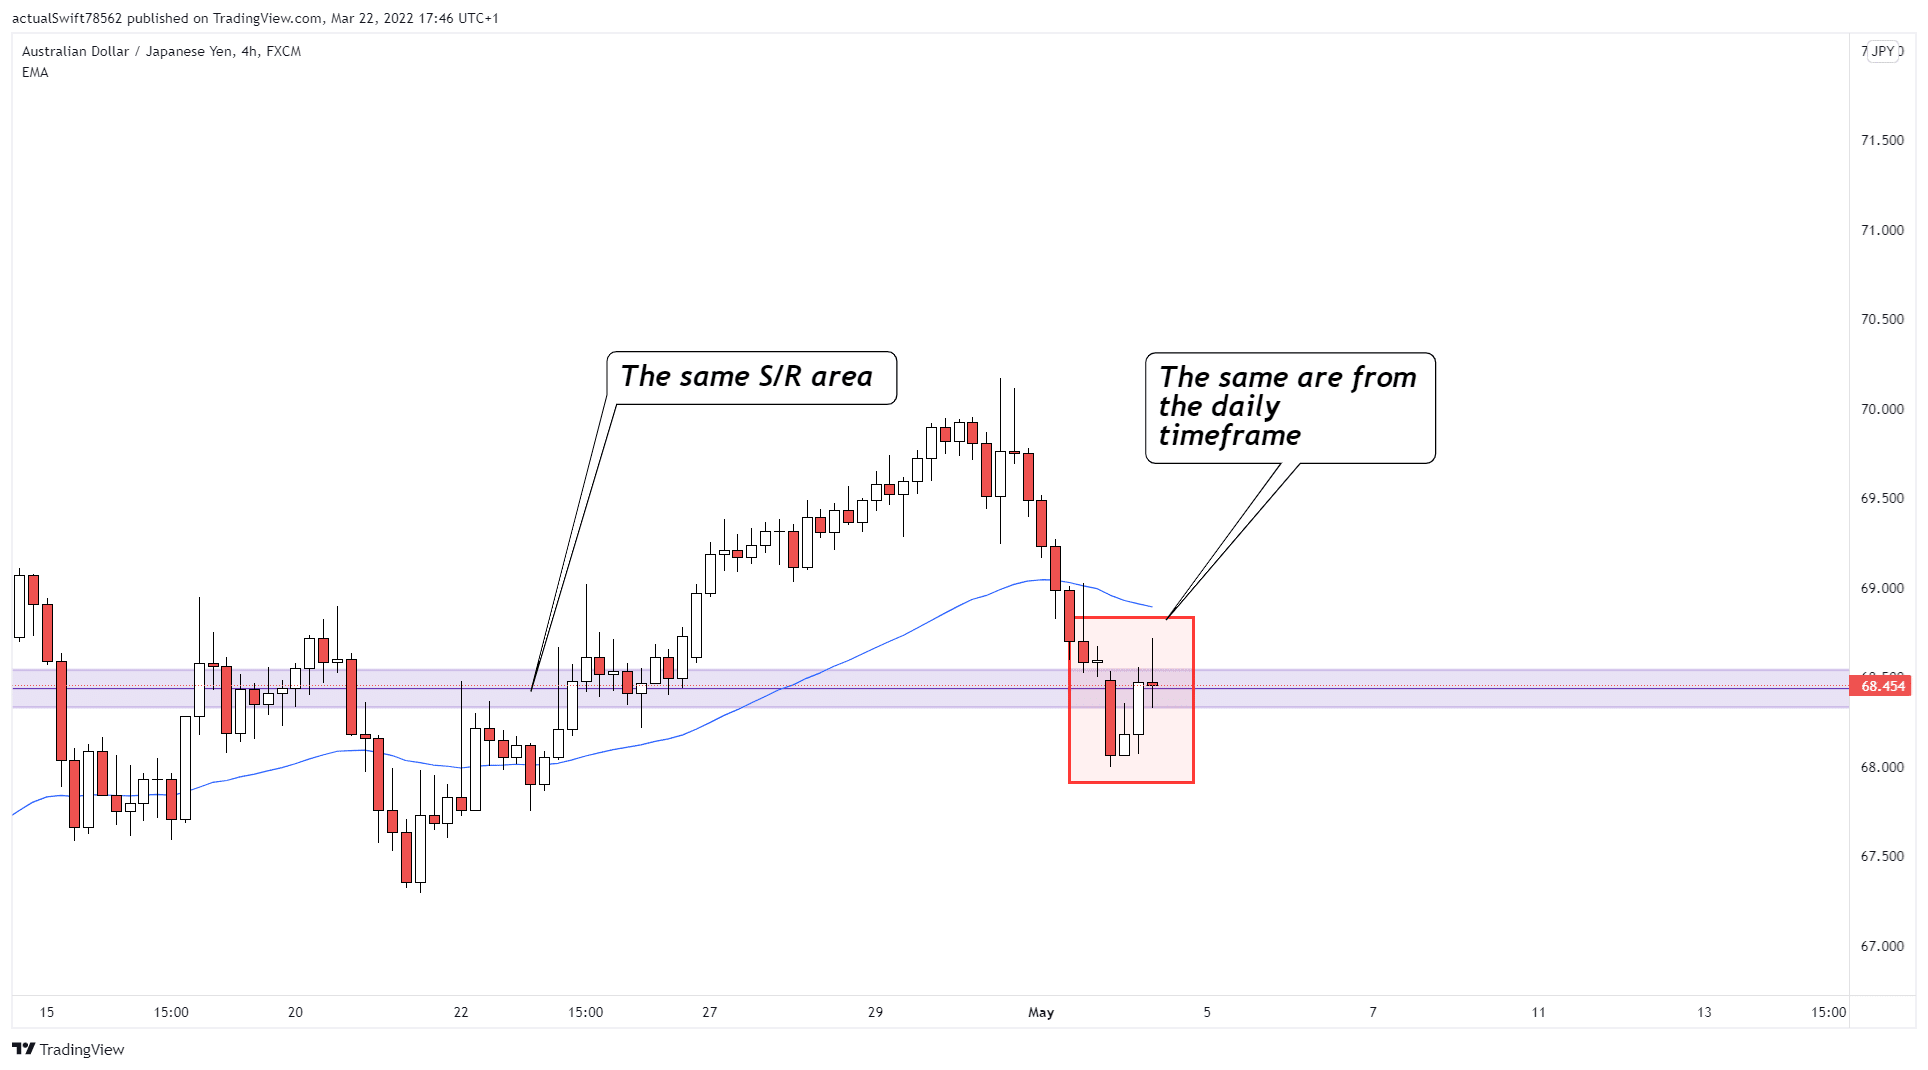
That shows us that we don’t have time frame confluence. One time frame is telling us to go long and the other is telling us to go short. Taking a trade there would be very risky.
In the end, the 4h time frame price action was accurate. Price moved down despite the perfect long setup on the daily timeframe.
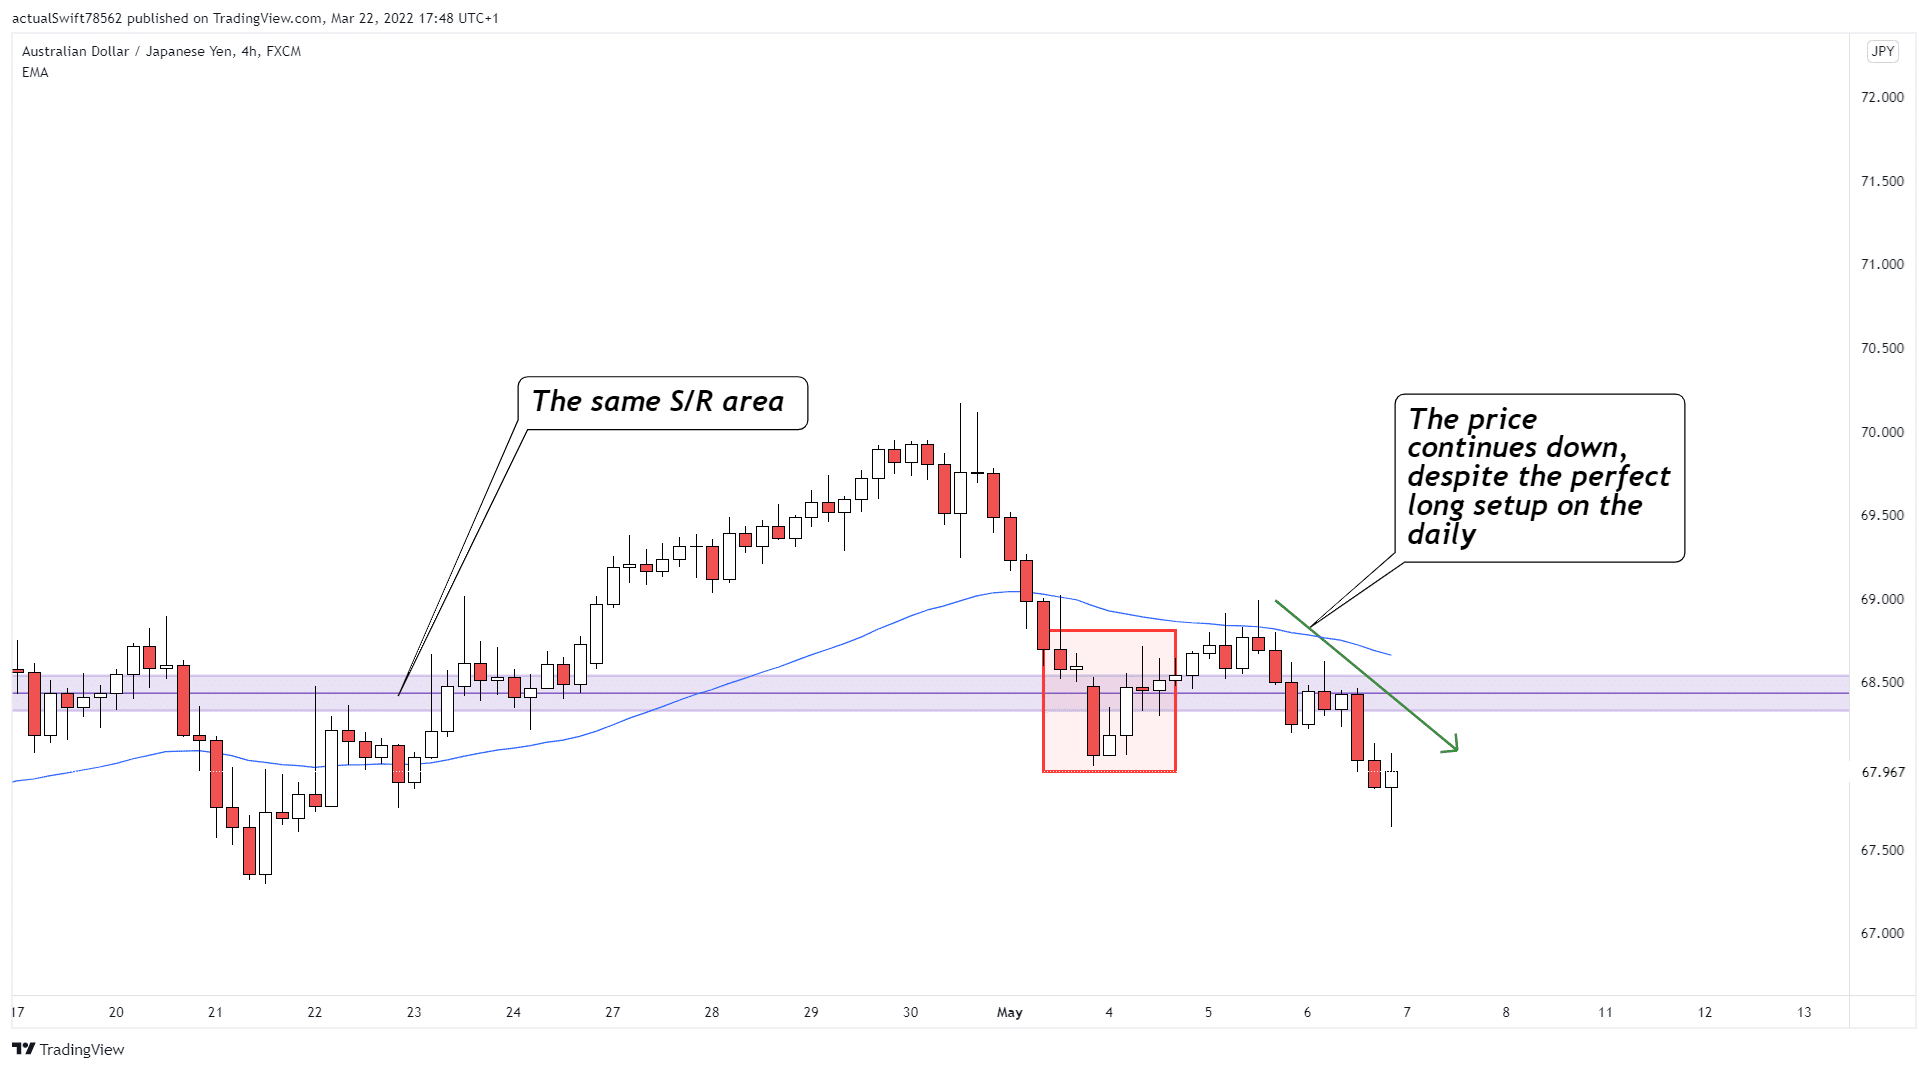
Now you understand why timeframe confluence is a great technique to eliminate losing trades.