Whenever you watch my analysis sessions on YouTube, you will often see me scrolling through multiple time frame on each pair.
I do this regardless of the time frame I am trading and for every pair that I trade – this includes commodities and cryptocurrency.
You may be thinking that this is a small part of my trading but in reality it is one of the most important steps in my entire trading ritual.
- Do you want higher quality entries, stop losses and targets?
- Do you want to have a stronger understanding of a pair’s price action?
- Do you want to know which potential setups are the strongest?
Then read on to learn how using multiple time frames in your analysis can help you achieve all of these goals and turn you into an even more profitable price action trader!
Why Should You Use Multiple Time Frame?
Before I show you how to use multiple time frames and what to look out for, let’s first understand what the point is. After all, understanding why we should add something to our trading routine will help us to implement any of those new steps.
There are three areas that using multiple time frames has a significant impact on. All three work together to elevate your trading to a much more advanced skill set.
1. Larger understanding of what recent data is telling you.
As price action traders we have one significant advantage with our trading style that most trading strategies do not have. That is the utilization of the most recent trading data to inform our trading decisions
However, a lot of price action traders don’t use this to its fullest potential. If you are looking at your pairs on the daily chart and that’s all, then you are missing vital information.
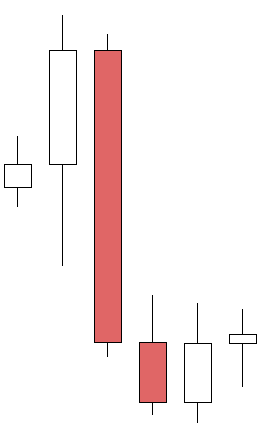
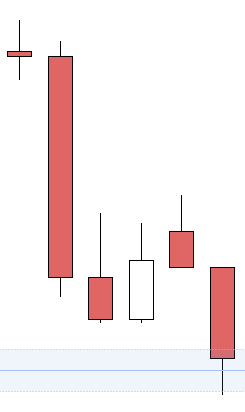
There are six H4 candles that make up a daily candle – each one tells us about the struggle between bulls and bears.
Those six candles give us much more detailed information on the struggle. Candlestick analysis is extremely important in crafting your trading decisions and these details enhance the quality of those decisions!
This extends beyond the daily chart though. If you are conducting your analysis only using one time frame then you are not seeing the complete picture of price action’s story.
As price action traders it is vital that we have a larger understanding of what recent data is telling us about price movement.
You do that, I guarantee you will see the quality of your analysis increase and therefore the quality of the trades you take.
2. Context of price movement
This ties in similar to our first point of understanding price action but goes one step further.
The context of price movement is crucial to prevent you from making bad trading decisions. Let’s say you trade on the lower time frames and look at the M5 – H2 time frames.
Once again, if you are stuck analyzing a pair on one or two time frames you are playing a risky game. We need to see the context of where price is and what we can expect to see from the immediate future.
Is price trending on larger time frames? Is price pending for a continuation? What major support and resistance is coming up?
These are all questions about the context of price in the larger picture. Would you go short on the lower time frames when on the higher time frames price looks to be going long from support?
No, you wouldn’t! That is why using multiple time frames is vital in giving you context on where price is and what it will do. It allows you to question what trading decisions you can make that don’t increase your risk of an unnecessary loss.
3. Pinpoint your trade parameters
Every single trader understands the need for good quality entries, stop losses, and targets. It is baked into our skillset and it can take time to truly master placing trade parameters.
What a lot of people don’t realize is that using multiple time frames actually enhances your ability to place high quality trade parameters. It makes it easier to find good levels because you have a more precise picture of price action’s story.
Your candlestick analysis is going to get you far if you give it the chance to.
But if you just sit on one time frame you are not using your skills to their fullest potential. Candlestick analysis is what helps to get the absolute best trade parameters and that is done by getting a complete picture of price’s story.
How to Use Multiple Time Frames
So we know why we should use multiple time frame in our analysis – but what do I actually mean when I say to use them?
There are multiple types of time frames. You have short time frame, long time frame, and everything inbetween.
Don’t worry, it is really simple and easy to do. The hard part is making it a habit!
Whenever you look at a pair on whichever time frame you simply flick through time frames and analyze the pair on each.
I use TradingView and you can customize the time frames in the top left.
Now you don’t need to spend 5 minutes on each time frame. We still want to maintain time efficiency after all.
I like to start out by looking at the daily chart as that gives me the larger context of where price is and what to expect over the coming days or week.
This broader viewpoint helps to prevent me from making mistakes. Let’s take a look at this in the context of an example.
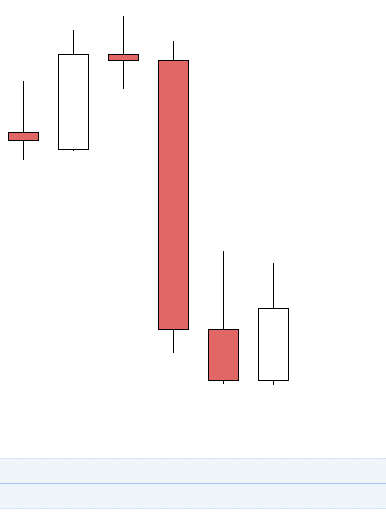
Price is trending down, on its way to support which is still a little way off.
Looking at the daily gives me this vital piece of information.
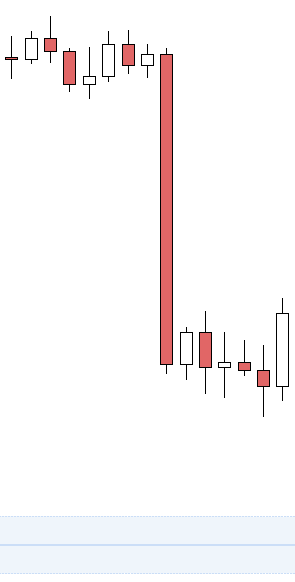
That means when I go to lower time frames I don’t make a decision that goes against the trend.
Why would I make that decision though? Well, when you go down to lower time frames you will see much more indecision. This is because there are simply more candles as opposed to the daily because we are looking at the details of price’s movement.
All this indecision can trick traders into thinking that a setup is forming. Afterall, we see indecision and that means there could be a trade, right?
Wrong. This is why context is so powerful. By looking at the daily chart first and understanding the current trend of price, I am now able to make better trading decisions when I shift to other time frames.
You can see how that context proved pivotal in this example with price pushing down to support after only a brief retrace.
So on any pair you trade, I recommend starting from higher time frames and working your way through to the lower.
It can be as quick as 5 seconds if there is no information you need, or it can result in some extended analysis to help you pinpoint a trade.
You can check out my daily analysis videos and see me do this on many of my pairs. As you become more advanced you will be able to spot potential setups on the 2 hour chart from the daily chart.
In order to get there though, you have to start from the beginning and train your eye. At the end of the day, spotting setups is crucial.
Otherwise how will you know about any setups? A “signal service” some of you might say, but we are pushing toward independent trading, not relying on someone else.
So start today! It is a small change to make but over the long run it will elevate your trading in a significant way. Turn this into a habit and you will see the benefits in your trading results.


Comments are closed.