Ever since I opened Forex4Noobs.com people have been asking me how I know when to enter a line break. This is because I do not enter all scalp/constant line breaks. Sometimes I do not enter simply because the trade doesn’t look right!
So naturally newbie traders are curious as to why I sometimes do not take bad trades. And when they ask me I always say I know because of “intuition based on years of experience”. Just like a seasoned cop can spot suspicious behavior in a person I or you couldn’t. The cop has intuition based on years of experience.
However, I believe I have finally figured out a way to better explain this. Hopefully you guys find these Forex tips useful. It may sound silly to start with but stick with me here.
Imagine a stampeded of bulls rushing through a large empty field.
– The bulls represent the movement of price.
– The field represents empty space on a chart in which the price can move.
Please note that the bulls do not represent the figurative bulls and bears of financial markets. They represent price in general (both bullish and bearish). I just needed to buy stock images to make the animations in this article and the bull was the only usable image of an animal I could find. That is the only reason bulls represent price as opposed to rhinos or elephants.
Now imagine a fence on that field directly ahead of the bulls.
– The fence represents a scalp/constant line on a chart.
When the price approaches a scalp/constant line on a chart many things can happen. However, most commonly one of three things will happen. Let’s take a look.
Hard Barrier
Imagine the bull stampeding through the vast, empty field. As they run they come closer and closer to the fence.
Each step brings them closer and eventually they hit the fence! But for some reason they cannot get passed it. They managed to reach the fence however they’re not strong enough to get passed it. Try as they might they simply cannot push through.

Now replace the bulls with the price, the field with the chart and the fence with a scalp line.
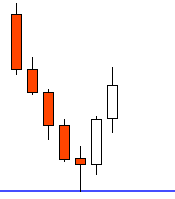
This time the scalp/constant line acts as a hard barrier preventing the price from moving any further. So the price approaches the line, sometimes slowly, sometimes fast but it cannot break the line. Maybe it pushes past by a pip or two but the price cannot really break the line.
This happens occasionally and it usually results in the price reversing from the line. Obviously in this event you would not want to get in the trade. Look at this kind of line approach with candles on a 5 min chart.

Barrier Break
Again, Imagine the bull stampeding through the vast, empty field. As they run they come closer and closer to the fence.
As they get closer to the fence and they speed up, they move faster and faster. Finally they get to the fence and BAM they leap right over it! Almost as if the fence doesn’t exist they fly over it and keep on running.

Again, replace the bulls with the price, the field with the chart and the fence with a scalp line.
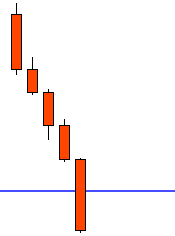
So this time the scalp/constant line doesn’t even hold the price back. The price breaks right through the line and keeps on going almost as if the line doesn’t exist.
This is obviously an optimal time to get into a trade. This means that there is a lot of momentum. So entering a trade here would be perfect. Take a look at an example on a chart, the candles represent 5 min.

Barrier Trickle
Imagine the bull stampeding through the vast, empty field. As they run they come closer and closer to the fence.
They could be running fast or slow, it doesn’t matter. Eventually they hit the fence! They can’t jump the fence but they back up a little and try again. They do this several times trying to jump. Eventually a few bulls manage to jump over. Encouraged by the sight of some bulls making it a few others make it over. The more bulls that make it over the fence the more encouraged the rest get. Soon all the bulls are jumping the fence.

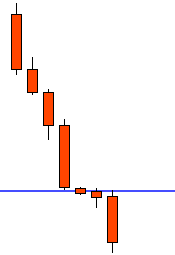
This time the scalp/constant line held the initial surge back. However, slowly but surely the price manages to break the line by a few pips. Maybe it backs up a little, but then it pushes straight back against the line and it manages to break by a few more pips. Eventually the price builds up enough momentum to push past the line and become a proper break.
The barrier trickle is the most common event. You will find that when the price reaches a scalp/constant line most of the time it will have some trouble crossing. However, with a little time the price picks up the momentum it needs to push through the line. Here it is on a 5 min chart, you can clearly see the trickle here:

So when the price reacts like explained above I will likely enter a trade. There is another thing to consider though.
Price Reliability
The price cannot be perfect. Let’s say you have a long scalp line set on your GBP/JPY chart at 150.00 and the price nears the level. After the price hits the 150.00 it tries to push past it but it cannot. If it pushes past by 1 pip to 150.01 many would consider the line broken. However, that doesn’t necessarily mean the line is broken. You need to account for a margin of error from your broker. While your brokers price may display 150.01 mine could very well be showing 149.96 (5 pips lower than yours).
The price cannot be the same with every broker. So when looking at a line you should not enter the second it breaks. The key is to watch closely and allow the price to guide you. The price will tell you by how it reacts at the line if it will reverse or break the line.
If you need a better view of the price action consider dropping from the 4hr chart to the 15 min or 5 min chart. The smaller time-frame will give you a much clearer picture of price movement. Imagine watching the bulls stampede through the field from 1000 feet in the air. They would all appear like one large mass. However, if you watch from 100 feet you can clearly see what each bull is doing.
So the idea is not to enter instantly when a line breaks, instead analyze and decide what the price is doing. Realistically, you need to do this analyzing in seconds, so it does take experience. However, I hope now you have a better idea of what to look for.
Worse comes to worse, remember the bulls running through the field. Are they being held back by the barrier or are they breaking it? If they’re breaking it enter, if not STAY OUT!


Comments are closed.