Forex Price Action Scalping (2024 Update)

Scalping using forex price action is a huge rush.  If done correctly, it can lead to a profitable trading strategy.

From my 15 years of trading price action on large time frames, I can tell you that dropping down to short time frames and scalping based on Forex price actions helped a lot.

But forex price action scalping can also be fun, and it teaches you a lot about price action, and Forex trading.

At BullRush Academy we often say that there are three core skills that you need to master to be a great Forex trader.

  1. Your trading strategy
  2. Risk management
  3. Trading psychology (mindset)

And you know what? Taking  Forex price action strategy from the high hourly charts down to the 5 and 15 minute charts allows you to master these skills much faster.

As good as scalping sounds, it can be nerve wracking, tense, but at the same time it is incredibly rewarding.

So how do you use price action to scalp the Forex market? Well let’s start with the basics.

What is Forex Price Action?

Forex Price action trading allows you to analyse the Forex market without using indicators. Instead of indicators you use candles, support and resistance, and trend lines to make trading decisions.

We won’t cover forex price action basics here, if you want to learn the basics, check out our free price action strategy.

The point is that price action analysis allows you to predict with a high degree of accuracy what price will do next by understanding who has control of price, buyers or sellers.

If buyers are in control, you want to buy. If sellers are in control, you want to sell. It all seems very simple right? Well, some newbies make price action a lot more difficult than it needs to be.

So let me tell you a secret that will help you be a better price action trader.

Who’s in control of price?

Bull vs bear

Those four words are vital when trading forex price action.

If you ask yourself that question every time you look at a chart.

Every time you do your analysis.

Every time you even think about entering a trade.

You will be a better price action trader.

Many traders do most of their trading on larger time frames. And even on those larger time frames they constantly ask themselves “who’s in control of price?”; that question saves many traders from making huge mistakes.

And here is why.

The question only had three possible answers… Buyers, sellers, or price is undecided.

If you spot a short trade which you want to enter and you ask yourself “Who’s in control of price?”, would you enter if the answer is buyers? No, of course not, if buyers are in control you do not want to sell yet.

Asking yourself “who’s in control of price” forces you to think about price objectively. It forces you to properly analyses price. Instead of making a hasty decision, you are forcing myself to make an informed decision.

Now, if you ask yourself that question when trading 12 hour charts. Imagine how much more important it is when you are forex price action scalping a 5 minute chart; when you only have about 30 seconds to make a trading decision.

So, if you want to trade a Forex price action scalping strategy, memorise that question. Who’s in control of price?

Being able to answer that question quickly and effectively is vital. And, it is also very stressful, which brings me to my next point.

You Need The Right Mindset For Scalping

The fact is, if you are a nervous trader, scalping is not for you.

Sorry… That is just the truth.

Forex is not all about having a trading strategy. A trading strategy is important but trading psychology is arguably more important.

You could try a scalping strategy and completely fail. Even while we are making consistent profits with it.

Why?

Because experienced traders have been trading Forex for 15+ years, so they have hardened their trading psychology. Those traders can withstand the stresses of Forex price action scalping.

When you are a beginner forex trader and new to trading, your trading psychology is a mess. you constantly close trades out too early out of fear.

New traders often let bad trades run in the vain hope that they would come back in their direction.

In short,  new traders often times do not have a trading plan; and let’s face it, even if you have a plan, you probably would not follow it. That is a pitfall of many new forex traders.

Through years of conditioning, you will toughen your trading psychology.

That is trading psychology.

So, do you think you can handle the stresses of Forex price action scalping?

If not and if you think you would be better off trading something slower paced for a while that is perfectly fine.

If you think you can handle scalping with price action, keep on reading.

Forex Price Action scalping basics

On larger time frames we specialize in reversal trading. We take price action based reversal from areas of support and resistance.

On short time frames reversals do not work very well. This is because reversal trading relies on identifying the precise moment in which a trend dies. On small time frames there is too much noise to effectively identify the death of a trend.

So a different approach is needed for Forex price action scalping.

forex price action scalping trades

We will be trading trend continuations. We will be watching for price action signals which indicate a trend is strong. We will then trade a continuation when price pulls back to a area of support or resistance.

This may sound simple but it is very stressful. One key component of this strategy is that you must maintain a risk to reward ratio of 1:3 at a minimum.

So, let’s sum up the basics.

  • We will be looking for trend continuations.
  • We will enter when price pulls back to our areas of support or resistance.
  • We will only enter a trade if our target is 3x larger than our stop.

That third point is the stressful one. When a trade is two pips from target and then reverses five pips… many people just close it out. You cannot do that, you must maintain the 1:3 ratio. Even if it means your stop being hit, you have to stick to 1:3. I will explain this in more detail later.

For now, let’s look at the actual Forex price action scalping strategy.

First we need support and resistance

You will need to draw the support and resistance areas yourself. Don’t worry though, it is very easy.

Let’s start with the two golden rules of support and resistance. These rules do not only apply to scalping Forex price action, they are also used for my normal support and resistance areas:

  • Recent data is always more important. Always.
  • Body bounces are more important than wick bounces.

Rule one is very simple. When placing support and resistance areas, fresh data is always better than old data. This is even more true on small time frames. Price action formations that occurred twenty minutes ago are more significant than formations that occurred two days ago. So when placing support and resistance, make sure you prioritize recent data.

Generally we only look at the last .

Rule two may be a little harder to understand. We will explain it in more detail in the examples below.

Let’s break support and resistance placement down into a three step process.

Step 1: Identify bounces

The first step to placing support and resistance is to identify bounces on your chart. Ideally you will want several bounces that line up nicely.

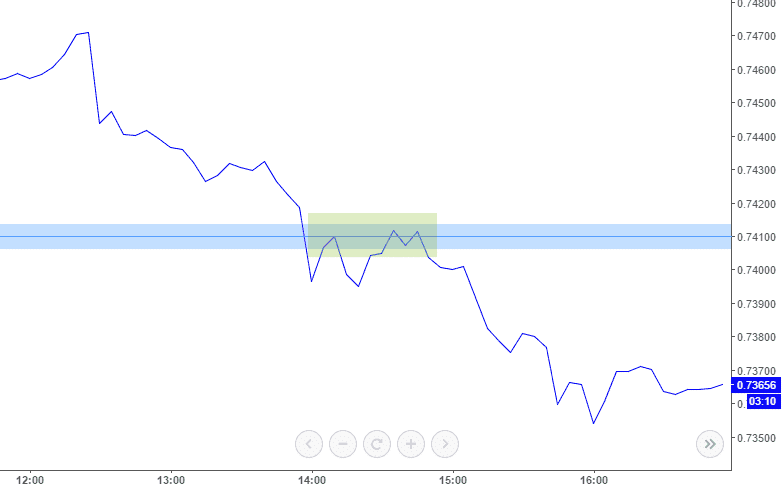
Below is an AUD/USD 5 minute chart. We have highlighted three sets of obvious bounces. The lower set mark out a support area, they are highlighted green. The higher set mark out a resistance area, they are highlighted red.

placing support and resistance for scalping

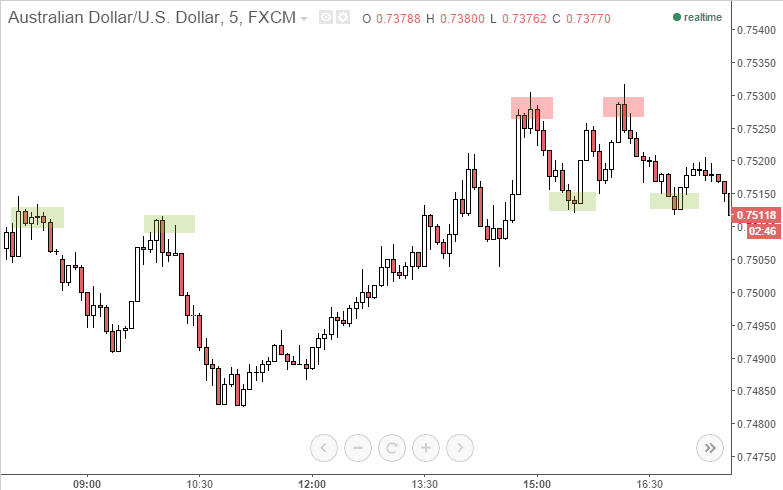
Bounces will not always be this obvious. However, the more obvious the bounce the stronger the area; so you should only try to identify the most prominent bounces.

Step 2: Draw a horizontal line and connect the bounces

Once you identify several bounces, draw a horizontal line between them and join them. You can see the AUD/USD image from above with support and resistance areas now placed.

two support and resistance areas

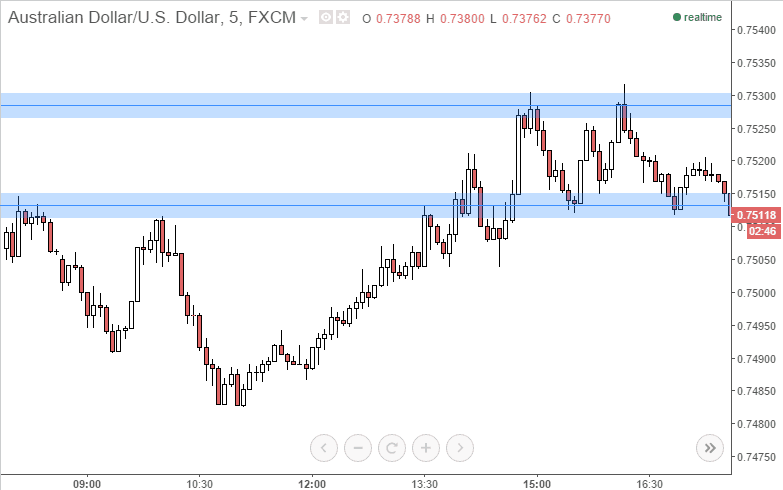
It is really that simple. You look for strong bounces and place lines there.

Support and resistance can be more complicated on larger time frames. However, on 5 minute charts, it really is easy.

Now remember rule two? Body bounces are more important than wick bounces?

You will notice in the image above I place my line at the candle bodies, not at the wicks. I do not like placing support and resistance at the wicks. I prefer to have my support and resistance where candles are likely to form.

I am considering adding a video on support and resistance placement. Feel free to send me an email to let me know if you need a video to clarify this subject.

Second you need to know how to spot a setup

You should now have a good understanding of how to place support and resistance areas. The next step is actually finding trade setups. And I am going to show you exactly how to do that.

There might be a small problem though. If you do not understand candlestick pattern and trend basics, the stuff below might not make sense.

If you find that your are struggling with the concepts below, jump over to my price action basics in the Forex education section. In there I cover basic price action and candlestick pattern concepts. Once you understand those concepts, the stuff below will be easy.

What a trend continuation looks like

I am sure you have heard the old saying, “the trend is your friend”. Well in this case, that saying is kind of true. We want to use price action to determine the trend, get a good entry and ride it for a short while.

You should already know how to identify a dominant trend, I talk about this in the education section linked to above.

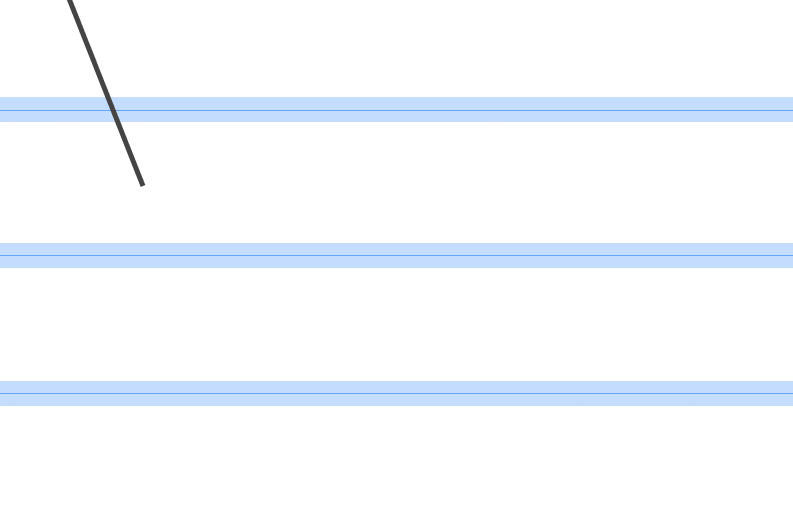
But the thing about trends is that they are rarely, if ever, smooth. If sellers control price for 24 hours on a five minute chart (288 candles) price won’t move down smoothly every candle for 288 candles. Trends move like this:

Real trends are messy

See how buyers push back up to the former support after sellers break through it? (marked in green)

That is how a trend works. In a bearish trend, sellers are in complete control of price. Buyers try to take control all the time. Sometimes buyers take control briefly but sellers regain control and continue trending down.

Here is an example of how trade continuation scalps play out. The image below is a gif, it will play like a video and show you how trade continuation trading works.

strategy trade examples

The basic concept is to trade with the trend. Using candlestick analysis with support and resistance allows you to determine if the trend is still alive. If the trend is still alive, you enter a trade for a quick 10-20 pips. Now, let’s look at some detail trade examples.

The Forex price action scalping strategy

You now know how to place support and resistance areas. You also know what a trend continuation looks like.

All you need to do to trade this strategy is put these two things together. I am now going to show you how to do this with a lot of examples. We will start with and AUD/USD short trade:

AUD/USD short scalp trade

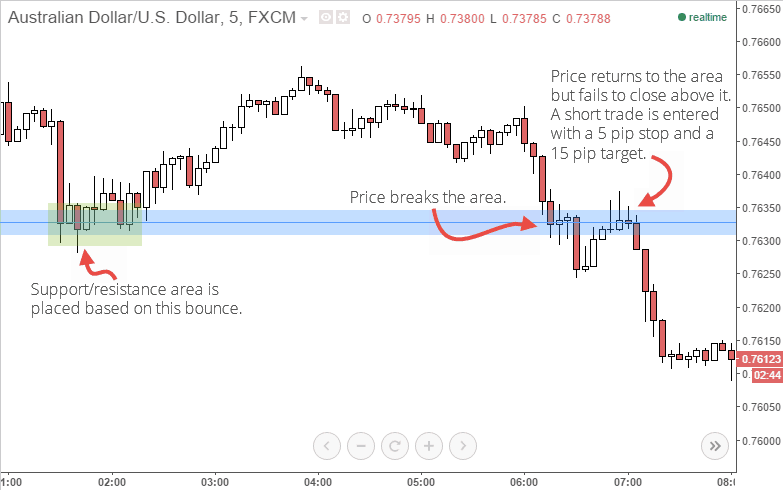
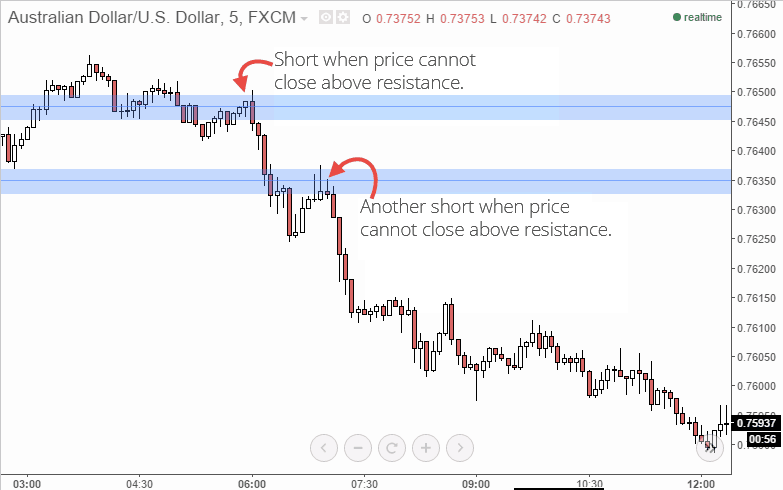
In the image above you see AUD/USD is in a downtrend. An area of support is placed at 0.7633 based on the bounces marked in green.

Sellers manage to break support at 0.7633. Buyers take brief control of price and push it up to the former 0.7633 support area.

Buyers make several attempts at closing above the 0.7633 area. Since buyers cannot close above the 0.7633 area, a short trade is entered. The short is entered because price is trending down and it is clear buyers cannot regain control of price.

That is a trend continuation.

Why is the setup above a good trade? Well, let’s do some quick and simple risk analysis on the setup. This analysis would be done when price hits the resistance area and struggles to break above it.

  • The major trend is bearish, this indicates sellers are in control of price (one point for sellers)
  • Buyers caused a minor reversal back up to resistance, this indicates that buyers have some power (one point for buyers)
  • Price is at a strong area of resistance (one point for sellers)
  • Buyers are incapable of closing above the resistance area (one point for sellers)

Sellers have three points, buyers have one point. This risk analysis is basic, we could do more complex risk analysis but a strategy like this does not need it.

The idea here is simple. You are using price action analysis to make an educated guess as to what will happen next. If sellers have control of the major trend and buyers cannot close above resistance, the bearish trend has a good chance of continuing. So, you make an educated guess that sellers will continue and you short, why is this profitable?

The key to this strategy

While making an educated guess about price works well on the 5 minute chart, it is obviously not perfect. You will find that you are right 50%-60% of the time.

However, being right does not matter at all. Remember how I said that your risk to reward ratio must be 1:3 at a minimum?

Trading with the bare minimum of 1:3 risk to reward, you need to be right only 25% of the time to break even. If you are right 33% of the time, you are making profit.

My actual risk to reward ratio with this strategy averages out to 3.7 as some trades have a 1:5 ratio. That almost means that I can be wrong 75% of the time and still break even.

The mathematics is on your side with this strategy. You use your understanding or price action to make an educated guess. As long as that guess is right 50% of the time, you should make profit.

As long as you manage to actually stick to the 1:3 risk to reward ratio, you should do well.

That is the problem though. If your trading psychology isn’t good, you will probably mess up the most important part of this strategy, risk to reward ratios.

Pairs and spreads

The pairs you trade will usually be determined by their spreads. The common stop loss for this strategy is 5-10 pips. So you need to trade pairs with very tight spreads to be profitable.

Your spread must be included in your stop. With a two pip spread, you would end up having a three pip stop on some trades, which is simply not viable.

Here is a list of the pairs I trade with this strategy.

  • EUR/USD
  • GBP/USD
  • AUD/USD
  • GBP/AUD
  • USD/CAD
  • USD/JPY

There are of course other pairs with tight spreads. However, I stick to the ones above as they work best for me.

Examples, examples, examples!

Okay, time for some example trades. These trades are all recent and they were either taken by me or members of the advanced course forum.

I am going to try and shoot some live trade videos for this strategy soon. When I do I will post them here.
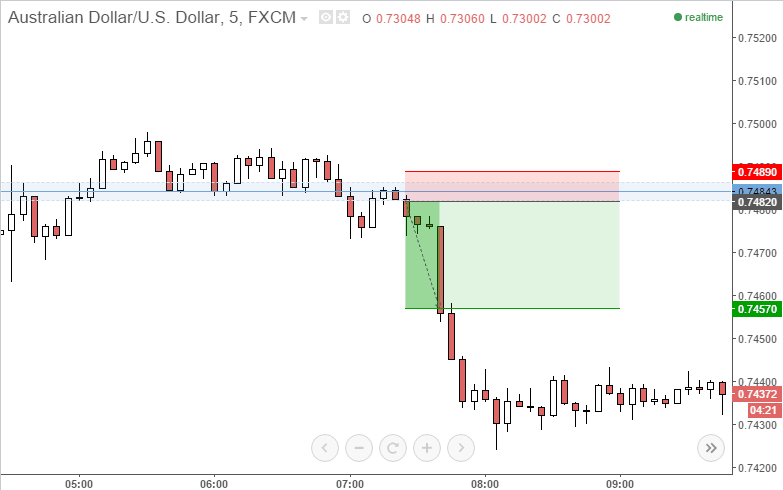
AUD/USD short trade

aud/usd short trade example

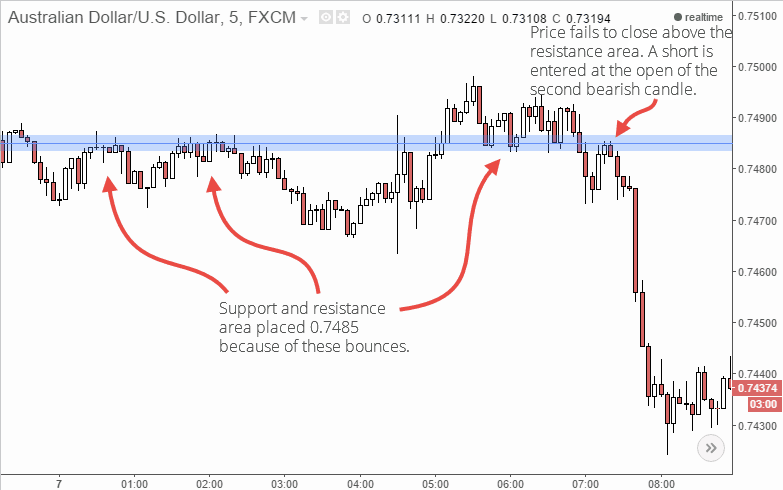
This was a very simple set up which formed on strong area of resistance. You can see clear bounces from the 0.7485 area over the course of ten hours. These bounces showed me obvious resistance in the area. Price eventually broke above the resistance area and resistance became support. There was actually a failed trade here which I will discuss later.

The short trade was taken after price broke below the 0.7485 support area. After the break, buyers pushed back up the the 0.7485 and tried to close above it. The fact that buyers could not close above the 0.7485 indicated that sellers were in control of price and that the bearish trend would continue.

A short trade was entered at 0.7482 at 07:25am UK time. The stop was 7 pips and the target was 21 pips. As you can see the target was easily met. The trade target was extended by 4 pips to 25 pips as there was great momentum. The overall risk to reward for this trade was 3.57, which is above the minimum of 3.

aud/usd short trade example entry

AUD/USD long trade

This trade triggered a few hours before the trade above. The set up was good but the trade never took off. The support and resistance area was placed at 0.7485 based on the first two bounces show in the image for the previous trade. When buyers broke above resistance price quickly dipped back down to test the area.

Sellers could not close below the area so a long was entered at 0.7488 at 5:50am. The trade’s target was 21 pips and the stop was 7 pips. This trade remained open for over an hour but in the end price dropped and hit the stop.

aud/usd long trade example

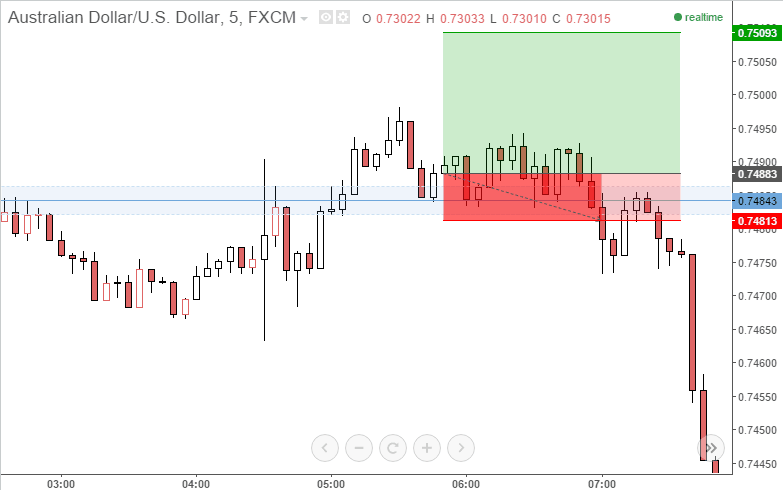
Could I have done something differently to save myself from taking a 7 pip loss on this trade? Maybe I could have, but it does not matter.

The key to trading this strategy is to just take the trade and let it play out. DO NOT close trades early and DO NOT widen your stops. If the trade fails it does not matter, all that matters is that you maintain a minimum of 1:3 risk to reward ratio.

If you take one hundred trades with this strategy and fail 60% of them you will still be profitable, have a look:

60 trades x -7 pips lost = -420 pips
40 trades x 21 pips won = 840 pips won
840 – 420 = +420 pips up

This is why it is vital to maintain a risk to reward ratio of 1:3 and this is why losses like the one above do not matter.

Trading Forex is not about being right, it’s about being profitable.

Let’s look at another recent example.

USD/CAD short trade

This recent trade example really illustrates why this strategy can be psychologically tough. It also shows you why you must stick to the 1:3 ratio, no matter what.

usd/cad short trade example

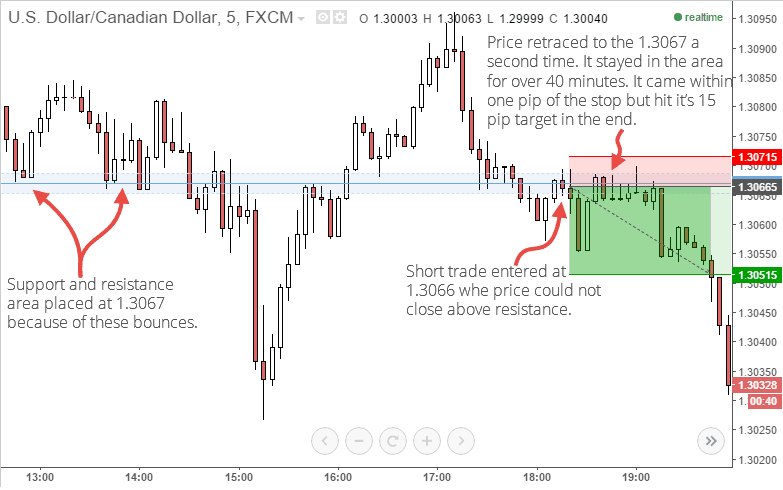
As you can see, the trade was open for only 10 minutes before price retraced to the entry. How do you handle this situation? Do you panic and exit? Do you calmly decide the trade is no longer good and exit?

NO!

You hold the trade. You need to trust your price action analysis and stick to the 1:3 ratio. Trades like this are quite common, trades will not always hit your target within 20 minutes. You need to be prepared to wait it out sometimes.

Stops and Targets

Stops and targets are pretty simple. Generally my stop is 5 pips and my target is 15 pips. If a pair is moving fast and a 5 pip stop is too tight, I may extend my stop to 10 pips and my target to 30 pips.

Targets and stops are the most subjective part of this strategy. You should stick to a 5 pip stop and 15 pip target when you first start. As you become familiar with the strategy you will understand when to use a slightly larger target and stop.

Ready to put Forex Price Action scalping into practice?  Join a Free BullRush Trading Competition.


200 comments

Hi Nick,
Thanks for all the education. The way you break it down and make it so easy to understand is commendable.
What kind of trading platform do you use that allows you to insert S/R lines easily. My platform doesn’t make it easy for me.

I use tradingview.com

Nice article on scalping low time frames. It’s a great refresher and pretty much the only way you can effectively trade the 5m chart.

Thanks for posting this.

Very good read thanks Nick. I noticed that the usd/car short trades you enter before the break of the low. Looks like you enter inside the zone on a reversal candle. Does that sound right?

Hi, this is a great tutor for price action scalping
Do you have historical data for your last trade? How many percent your win rate? Do you using fix 1:3, or sometimes using TS?
Thanks

is there a simple way to tell if a pair is in an uptrend or a downtrend? I have found that on most charts you could make the case for both.

You can use trend lines or moving averages. Focus on the relevant time frame for the trend. You can definitely make a case for both directions but usually there is a dominant trend. If a daily chart trend is down, and a weekly chart trend is up, the weekly chart trend is dominant. However, if I were to take a 4hr chart trade, I would be more concerned with the daily chart trend.

That was great, thanks dude!

Hi,

Should you close all positions when you leave the computer?

That is up to you. I generally leave mine open, my stop protects me if it turns around when I am not there.

Thanks for the quick reply =)

I was just worried that for some reason my stop doesn’t get executed and there’s a big move and I lose a lot of money due to my lot size being a lot bigger when scalping .

Should this be a concern?

As with any trade, you can be slipped, it is a reality of trading. Just take precautions like being wary of any major news events etc

Ok , thanks again =)))

I wanted to possibly scalp a few hours at the start of the NY session and also trade the daily charts at the end of the NY session for longer term swing trades .

I am going to demo all of this first of course but I was wondering how to handle scalps if I am in a longer term position on the same pair or correlating pair . What would be your approach if you were to scalp and also swing trade?

Thanks

Trade them on separate accounts, you should have an account for each strategy if you want to do proper risk management.

Sir i will like to know that if say i swing may weekly chart,daily or monthly..which chart should I use for entries…

Swing trading isn’t scalping. The stuff in this article isn’t applicable to swing trading.

Nick,

Do you everything from the 5 min chart? Or do you begin on a higher timeframe to address support & resistance?

Thanks, Anthony

P.S. The website is great!

Thank you for the time you took to put this all together free for us Mr Nick, Gid bless you. Sir do you know a website or app that we can calculate the 1:3 ratio sL?

No problem Mathias. I use tradingview’s long/short entry tool to determine my ratio. I am sure a quick google will come up with some options for you.

Great post. I use this strategy for higher tf was just considering using it for m5 before I stumbled on this post.
I however use trendline anf fib retracement for my trades.
Keep up the good work.

Cool, hope it helped!

1R with 60+% win rate is enough, no need for that stressful 3R in one trade. just do a set of three winning trades with double lot size each time you win. You’ll end up with 7R in total. Then repeat to 1R again. IF you lose, you lose 1R. You’ll have 6 more chance to retry for 3 winning trades. If you lose 3 times before getting 3 wins in a row, the end profit is still 4R.

1R trade is much easier than 3R. But IF tried 6 times and still can’t win 3 times in a row, that’s mean the skill/win rate is very bad and not 60%.

I use this exact method trading S/R in M5 with this MM targeting just 1R+cost (5+ pips stops/tg). with a little bit tweak I mostly aim for 4 to 5 wins (15 to 31R) in a row and repeat. that give me hell lots of space to lose more times.

You can also close partially at 1R+ and leave the rest to run. You’ll then double/compound that partial you’ve took profit and make the rest like a bonus. 4-5 wins a row will max out the margin in forex (with broker offering 500:1 leverage).

That’s a boatload of technicals in one comment, i have absolutely no idea what you just said!

i thought i was alone on this thought

I dont understand anything you said either. What is 1R, 2R and 7R? Geez!!!

This is referring to the risk-to-reward ratio which is the ratio between the size of your stop loss and target. So 1 RR means your stop loss is the same amount of pip as your target profit. 2RR would mean your target profit is double the pips of your stop loss, and so on. Hope that clears it up!

Nice article Nick thanks, can I use the same strategy on a 1min time frame and still succeed?

I am not sure, I have not tested it enough on 1 min charts as that style of trading does not appeal to me. Only way to know is to test it!
I’m glad you liked the article though! I’m actually working on an updated version, so if you’re interested keep an eye out for that! :)

How can I draw a perfect trend line?

I draw according to the bodies of candles, not wicks.

Hi would just like to know do you cover price action scalping in your forex mastermind course many thanks

I do not cover Scalping in my mastermind course at the moment, no.

Hi ,

I am going to try this scalping strategy soon and it says to add the spread to the stops . Is that for both buys and sells ?

Thanks

Thank you very much Nick.

This article is great in explaining the importance of Risk to Reward ratio and how powerful these S/R levels are.

Cheers.

Paulo

nice article Nick, i really like the way you set things out in an easy way to understand! keep up the good work

Hello nick,
I want to ask, do you plot the trendline on the 5 min chart as well?

Thanks for the reply, its an honour. Thank you for your effort as well. Much appreciated

Hi nick, kent here.
Been plotting the trendline on the 5 min chart. As the price is forming 3 swing high/swing low i draw the trendline. But it keeps breaking the line, any advice?
Plus between 2 big bounces and 4 small bounces, which one should i choose for drawing support/resistance. Thanks in advance

Hey kent, taru here.
Try plotting the trendline on m15 chart. Get the gist of it
I’d pick the bigger bounces than the small ones.

If you mean support and resistance, pick the big bounces. Also it is normal for support and resistance to break, they cannot hold forever. Trade continuations from the breaks.

Thanks guys.
I totaly understand the support and resistance now.
Trendline is my only problem.

verry nice *****

Hello, I wonder if you use trailing stop?

I’m so bad at this that I’m beginning to think if I were to keep my current strategy and do the opposite of what I think I should do, I’d have a 100% win rate.. All joking aside, I look forward to practicing what I learned on here. Very well written and easily understandable. Thanks, Nick.

Hi Nick,

great article. I know I came late, but I had to drop by and comment because of how refreshing it was. You made me want to open up a chart and try this out immediately. I was thinking about adding a 60 periods moving average to gauge the dominant trend, and an Average True Range to tell how easily my 5 pips stop is going to be hit.

Hi nick

Great guide thanks kindly.

I was curious about which time frame you place your Support resistance lines, i guess you place them based of the 5min chart rather than 15 min to chart due to how temperamental and sporadic the candles can be

Thanks again for this

I do place them on the 5 minute chart!

I am a beginner to Forex and am impressed by you instructional videos. I have just obtained a Demo a/c with IG. What is stopping me from making my first Demo trade is not having the ‘Target to stop’ calculation. Where can I obtain it. If it is on the IG platform where is it.
My main interest at the moment is the Daily trading so as I can hopefully place my trades on a Sunday and see what happens.
Your response will be gratefully appreciated.
Regards……..John Bainger

If you’re talking about the red and green thing on my charts, that’s the position tool on Tradingview. You can find it in the left toolbar.

U have really made my day. I’ve blown my account severally and I’m almost fed up before I came across ur strategy. I will go back to practice this with high hopes. Thanks so much, I’m impressed.

Thanks, glad to hear you’re impressed. Don’t worry too much, we’ve all blown our accounts at some point! Good luck !

Very nice article, thank you so much

Hey Nick,

Very glad to find you on Youtube and now your website. Out of all trading educators out there, the way you teach is the simplest and it just works. Looking forward to learning lots more from you. Thank you

Hi Jafar,
thanks man! That’s good to hear :) Good luck with your trading!

Very very helpful! Thank you

great stuff! Thanks

thank you nick…im learning

I am in need of the course i deadly loved your teachibg

Thanks for the encouragement! I am working on it :)

Excellent work sir, keep it up, GOD Bless you!!!!!!!

Nick at what time frame is best to place my support/resistance areas?

Daily time frame is best. I go over placing s/r areas in more detail here

I’m confused, do we draw the resistance/support lines on the 5min or daily chart. Your tutorial says 5 min.. thanks for the excellent content btw..

-Lenny

For scalping you place it on the 5 minutes.

I am very thankful for this whole article. . . . Its worth reading multiple times.

thank you for the article. . . .I have learnt a lot from it. I will save the page and read over and over again.

HI NICK
Thank you so much for the educational video as they are making a huge impact on my trading but id like to know when will we getting videos for 5 min scalping??

Thanks for your interest ,
I am working on creating these videos. If you’ve signed up to the mailing list you will be getting an e-mail when these videos are out!

Thank you in advance Nick, you are awesome!

hi, i am having trouble placing SR. Its a bit messy.
what time frame are you placing SR on?

As mentioned, for scalping you play SR on the 5 minute timeframe.

Thank so much for this detailed post please can you Crow more light on how to enter a trade after analyzing it on trader metal 4 please to calculate the stoploss thank u

Check out the “strategy” section of the site.

Thank you sir I notice I can’t trade with trade view

Nick,

Thanks for the awesome advice. I just wanted to clarify the stop loss point you made. If I have a spread of 1.4 pips, I still set the stop loss to 5 when I place the trade (and not 6.4)?

Generally speaking yes, you include the spread in the stop so it would be 5 pips.

Awesome post! I use this same strategy but with the help of Bollinger band and a few MA’s. My trick to winning most of the time is to trade with the current trend and to take only the best setup! That’s it! Keep it simple: Rinse & repeat!

Do you have any videos showing scalping? I find complicated the waiting for candles to close and keeping the 5 pip SL above the candle. Do you wait for candle confirmation or as soon as the price get to resistance you enter the trade?

No videos at this time. I usually wait for closes.

No videos at this time. I usually wait for closes.

No videos at this time. I usually wait for closes.

Do you have any video using this scalping strategy?

Your stratage is good

Hi Nick
do you trade this strategy in some particular session ??
or is it not important ?

thank you

Hi Gerardo,

It works well in all sessions!

thank
I am starting to use it in demo

So fantastic.
I’ll like to join your forum.

Please I will like to know the trading application you use for your trades because this so doesn’t look like mt4 or mt5 and also am finding it difficult to actually choose a broker, could you please help me with two or three brokers which I could choose from as a nigerian

I use TradingView for my charts. As for finding a broker, I can’t recommend any specific broker. Instead, I teach people how to find a good broker in lesson two of my free course ( https://bullrushacademy.com/topic/finding-a-broker/ ). Hope this helped!

wow i love it man!!!! no lies to sell something pure truth on what is trading.

Thanks Bruno, glad you love it :)

I appreciate a lot, u r nice to us sir am praying to be like u in trading

Yeah, a little hard to understand your meaning. Can you please explain your method again but without the jargon.
Cheers

The above was a reply/ request to Wolve.
Here is the earlier post from Wolve (copy/pasted below) I am seeking clarification on.
……………………………

WolveAugust 21, 2017

1R with 60+% win rate is enough, no need for that stressful 3R in one trade. just do a set of three winning trades with double lot size each time you win. You’ll end up with 7R in total. Then repeat to 1R again. IF you lose, you lose 1R. You’ll have 6 more chance to retry for 3 winning trades. If you lose 3 times before getting 3 wins in a row, the end profit is still 4R.

1R trade is much easier than 3R. But IF tried 6 times and still can’t win 3 times in a row, that’s mean the skill/win rate is very bad and not 60%.

I use this exact method trading S/R in M5 with this MM targeting just 1R+cost (5+ pips stops/tg). with a little bit tweak I mostly aim for 4 to 5 wins (15 to 31R) in a row and repeat. that give me hell lots of space to lose more times.

You can also close partially at 1R+ and leave the rest to run. You’ll then double/compound that partial you’ve took profit and make the rest like a bonus. 4-5 wins a row will max out the margin in forex (with broker offering 500:1 leverage).

He is just saying that your risk to reward ratio should be 1:1. So if you have a 5 pip stop loss your target should be 5 pips plus the spread which would make the target around about 6 pips.

After that what he says stops making any logical sense so I think it is best ignored.

In order to understand it you need to understand R multiples. While they sound complex they are quite simple. R multiples are a consistent and easy way to define risk, reward and return.

  • A risk to reward ratio of 1:1 equals 1R if you lose and 1R if you win.
  • A risk to reward ratio of 1:2 equals 1R if you lose and 2R if you win.
  • A risk to reward ratio of 1:4 equals 1R if you lose and 4R if you win.

He claims that with a 1:1 ratio he is getting a return of 15-31R on 4-5 trades. A 1 to 1 ratio means that your return on each win is 1R so 4-5 trades would result in 4R-5R return. What he is saying makes no sense at all.

Also in trading you cannot “aim for X wins in a row”. Some trades are wins and some are losses, you cannot really influence the outcome of a trade so aiming for 5 wins is not possible.

like he lost me after the first paragraph… lol…!
i am so psyched looking forward to today’s webinar!!!

Yeah, his comment makes little sense.

Hi Nick,
I was backtesting this strategy but i’m not clear on the following: do you use the line (in the middle of the blue field) as an entry point (after the candle is closed and failing to go higher or lower) or is the retranchement into the light blue field enough? and what is the size of the blue field/area? Is it always the same or do you base it on resistance and support levels?
Do you also wait for a candle indicating the trend is about to continue (after it hit the blue field/line?) or do you enter right away?
Thanks for your answer!

The shaded area is inconsequential and doesn’t actually mean anything, you can use a solid line or a shaded area. I personally prefer the shading so I use it.

I enter after the candle which fails to go higher or lower closes.

1. Price breaks through support or resistance.
2. Price retraces to support or resistance.
3. Price forms indecision on support or resistance which usually shows as a doji, spinning top, hammer etc.
4. Trade is entered after indecision closes.

Thanks for your time and answer! Happy Trading :-)

Excellent work sir, keep it up! Bless your heart!!
Thank you!

Just wanted to say THANKS.

First trader I have come across who really does want to help and not sell his course every other word.

Have tried so many strategies and filled my screen with indicators upon indicators , which just confuse and distract me, I now have removed them all and focusing on price action and find it much better !

I am learning a lot so thank you very much.

Happy to hear that I can be of help Paul! It can do wonders for your trading to escape the fog that indicators can bring.

Sir I have a problem here my mentor says we must always place our support n resistance on wick not on the opening n closings of the candle… And it confuses m bcos the wicks represent the highs n lows of the candle.and that always gives m problems with my support n resistance especially on higher time frames…

I go really in depth on how to place support and resistance areas in my strategy. You can find it here : https://bullrushacademy.com/forex-trading-strategy/#Chapter2

Hi Nick, great article.

Just a question about how recent the data needs to be to plot the SnR. You have a sentence that says:

“Generally I only look at the last .”

Can you please tell me what is supposed to come after “last”. So you only look at the last ???? candles?

Thanks

Rob

You all will agree with me that this guy here is the main shit
Every other person would sell this wealth of information
Who so ever starts making steady income should go pay homage to him, he is worth every of it….
Thank you Nick
I would personally want to come closer to learn whether through Skype or mail

Thank you for the incredibly kind words! You can contact me via the FAQ page if you want to see details of 1-on-1 mentoring.

Do you ever move the stoploss to break even?

Please nick can you just make one little video showing how to take a set up just one example would do… i have been trying this out and i KNOW i am doing something wrong… please?

I will do at some point soon.

Hi Nick,
Thanks for this strategy,
can we use it with other instrument like “Indice” or it’s only for “forex” trade?

thank you.

Hi Yvens,

I haven’t tried trading with this strategy on anything other than Forex so I can’t confirm if you can. I think you probably could, but like I said I haven’t tried it.

HI NICK
please can you explain or provide a video on understanding position sizing in every trade that must be taking I really need ur reply.

I will put it on my list of videos. There should be some good videos on YouTube that explain it in the meantime though!

Hi nick, when your placing support and resistance on daily chart, and have it all setup, but then you wanna scalp that pair one day, do you have another chart layout with the 5min support resistance setup for that pair ? or do you layer 5 min s/r lines on that same chart layout pair with daily s/r lines on chart as well… reason im asking is daily chart s/r covers so much of that, and then when adding 5 min s/r theres just more lines everywhere. how do u simplify it when trading daily setups and scalping 5 min setups on same pair, when it comes to having s/r lines from higher time frame and lower time frame.

I have a scalping layout and a day trading layout, they are completely separate. I do not place daily SR on my 5 min charts at all.

Are you planning on doing a Price Action Scalping Course like in steps layed out in videos, like your default price action reversal course that is in steps in video ?

Yes, it is coming very soon but it will be for current course members only while it is in beta.

How do you create a separate layout ?

Here is a quick video showing you how it’s done

https://i.gyazo.com/5c6aa7be0991f4785ec150404c82ae8c.mp4

You can also check out my TradingView beginners guide for more tips

https://bullrushacademy.com/tradingview-beginners-guide/

SR Areas

I’ve noticed 2 things:
1) after you find an SR area, you round it (e.g. 0.13454 turns into 0.13400). found it by comparing your SR list to mine (after all connecting 2 dots is simple)
2) when you place on the candle body you don’t care if it’s red or green/white candle (e.g on support area you’ll create SR line on the downer part of the candle body even if it’s a white candle)

Am i right ?

1. No I do not round it, I just put it where it best fits. Many times support and resistance naturally falls at rounded levels.
2. That is correct, the body colour does not matter.

Thanks a lot really grateful ,with this i can achieve my goals , thanks again for making it free ,

Where do you trade from, I mean the country and how long have you been trading?

great content and thanks for sharing.

quick question.

Roughly how many support and resistance lines do you tend to get on your 5 min chart if you base it on the previous 2 days price action?

many thanks

Generally two or three

HI Nick,
In the last trade USDCAD you say that you should trust your price action analysis and stick to 1:3 ratio.
But it seems to me that you analyse the movements of price [candles] up to the entry, then you enter.
After that you stop analyzing what is happening to the price and simply rely on your 3-1 backtested strategy, regardless of what the price shows.
After entry seems like your throw through the window your price action analysis skill.
I mean some traders have fixed SL and mental SL based on what happened with the price after entry.
Ok , maybe here 5 pips SL so no much space to close trade before it hits the stop loss.

Do you ever close the trade which goes against you with less than 1R loss – let’s say on your daily reversal strategy – or always allow your SL to me hit ? Do you use your price action analysis skill after entry or after entry you stop reading the price and simply rely on your back-tested results ?

My Regards
Mariusz

I need more of your video clips. I gained I gained a lot from your strategy.

I thank you so much for your transparency..

I agree with you dude,, it’s very devastating seeing that price goes well below your Take Profit but we must be discipline don’t we?

well, you know what they say.. “CONSISTENCY is more important than that one BIG trade”

Hi. Anyone. How do I know which brokers are supported with the trading view platform? Looked on their site and can not find it. Thanks, Kathy

TradingView is primarily a charting platform, while it does integrate with some brokers you are better off having a separate broker and charting platform. I think TradingView only supports Oanda and Forex.com

Thank you dear sir.

Hi Nick
Am so grateful and thankful to God that I found you and your work work,
Am trying to adopt to the the strategy mostly scalping with price action
The problem I gat is with my broker
The spreads…….! Hopefully you can understand my problem
I wonder whether you can tell me the broker you are trading with…
For really Ijust pray For a divine reward for you….
Thx

Very informative . How does large money translate into smaller time frames ? support and resistance and how volume aides or interferes with price direction?

In my opinion, activtrades and darwinex are among brokers with the best spreads. It also depends what forex pairs you want to trade, but those two above are really trustworthy (for paying you without any problem). Activtrades have no commission, and darwinex have a little commission.
Anyway, search on google something like (for example) “best spread for eurusd” (or gbpusd or xauusd or…….) and open a demo account on those brokers, and open some operations (morning, afternoon and evening) to be sure which of them have the best spread + commission for the pairs you want to trade.
And of course, use any of the multiple indicators which tells you every moment the current spread.

I really appreciate the information here so much value. I would like to know what time frame do you consider as your major trend when trading the 5min chart

Just made 18 PIPs with this on AUDCAD. My stop was pretty tight at 6 PIPs (especially with a larger spread on this pair), but this strategy worked like magic! Starting to do some back testing and wanting to incorporate this into my daily trading. I did have one question: Once I was in profit 2:1 or so, should I move in my stop to Break Even or just leave it until either the take profit or stop is hit?

Just used this strategy for myself, it worked, 15 pips made. Thank you!

hi Nick.
Short trade need the brocker which the pairs have tight spread,nso could you introduce me which is the safe broker with low spread.
thank

Please nick
Does your drawn lines comes with those coloured zones, if yes what platform do you use
if not, what range do you use.

I use TradingView, here’s a gif that shows how I get the coloured zones : https://cdn.bullrushacademy.com/wp-content/uploads/2017/09/parallel-channels.gif

Great work .. Explained in a very simple way !

Can you also throw some light as to how to identify 1:3 RRR setup ?

Regards.

TradingView has a great tool that visualizes the risk-to-reward ratio. That’s what I use.

I am very much new in Forex and I have gone through lots of write-ups but none gave me the level of encouragement that I can confidently make it in Forex except these ones in forex4noobs. The more I read these write-ups the more Forex trading becomes simpler even though I have not started my DEMO training.

One thing I must promise here is that all my training starts here, I have enrolled in the Mastermind today in the waiting list. I believe I will train under you and be my best in Forex trading. Thank you.

I

That is amazing to hear, I am really glad you find the content to be what you are looking for! Use that motivation and drive, it will help you be successful in so many things, not just trading.

This is great, am glad for the job Mr. Nick is doing here. Thanks.

Hey Nick, is it okay if I go for 10-15 pips? (still sticking to the 3RRR)

If your analysis of price action indicates so, go for it! There is no strict amount of pips you need to abide by.

Thanks for the reply. Btw you’re a gem among forex education sites. Keep up the great work.

Hi Nick,
Thanks for all the education. Please give me a call are your cell number

To be honest with you, this is the most educative and well illustrated article I have ever read. Thanks for sharing the good Idea, keep it up I appreciate.

Wow thanks for the kind words, means a lot to hear them!

Thank you for sharing this! I have one question, do you avoid trading during major news events?

This scalping strategy is quite interesting, but it needs more practice for one to see clearly what is happening, I am more interested in spotting continuation. I would kindly ask you to send me more pictures to make more analysis on the strategy. Thanks a lot.

Hi Nick

I will definitely try this strategy for the next 2 months. It looks simple and promising. I like the way you simplify things, you make it easy for newbies to understand. Thank you very mu.

Ms Beauty, from Windhoek, Namibia, Southern Africa

Best of luck Beauty! Use all of the articles and videos on my YouTube and site, there is a bunch of free content that should get you pretty far!

Educative. A few questions:
1. Can I trade stocks using your methods.
2. Can you give me a Price action strategy for intraday please for stocks. I dont trade currencies.
3. Ypur Scalping system seems really good. Have to try it though.

I don’t know enough about trading stocks to have an informed opinion I am afraid sunny! To create a strategy for that would require an immense amount of time and commitment on top of the thousands of students I already have, so unfortunately that doesn’t seem likely anytime soon.

I can’t realise how to draw S/R area instead of S/R lines. The point I can,t realise is how much wide the S/R aria. how can I determine the wide of the area?

The width of the area does not matter – it just helps you to remember that SR are not specific levels but areas where price will meet a barrier. You can make them as wide or thin as you like!

Ok sir. Thank you very much for the reply.

Awesome Strategy!! Do you have a link for youtube on this ?

No, I do not have videos for this strategy

Thank you for this free article Nick. I definitely need to read this again and again.
Are you planning on making a video version soon? I enjoy watching and learning through videos more so I hope you can put this up on YouTube soon.

I will put a video on my to-do list for scalping as it is getting more attention recently. I did release a video recently on trading through corona and volatile markets in general where I go over a short time frame setup, a breakout, which is probably worth a watch!

hello nick sir , i am vivek from India i trade in US proprietary trading firm , according to our scalping article our risk reward is 1:3 , when we entered in trade and our trade is stuck between our stop-loss and target we r intraday traders what can we have to do , we have to close the trade or we have to wait for whole day . thank you for all of these today i started to test this statergy . thank you

It is really up to your trade management and what price action is telling you. If price is moving sideways for a few hours, you may want to consider exiting. It depends on your analysis of the charts and where you think your trading margin will be best used.

Thank you nick sir for your support.

hello nick sir , when we entered in trade after some time trade is in favor but not hit target can we change the stop loss or not . thank you

Sure Vivek, moving your stop loss to Break Even or using a trailing stop is common practice. You need to test this out and see what works for you though!

OK nick sir I m in process after completion of 100 trades I thought I will get the answer.

Hi Nick,
Thanks so much for these strategies, I as a newbie still am trying different types and the ones you present are well structured and in a way that I can learn. I’m just going to practice now.
One question though, for this scalping way of trading, do we place orders manually? Do we have an entry point? How do we determine this since often the price doesn’t show a signal before a strong bullish or bearish rally.

You can place orders manually or set pending orders, it really depends on your activity or if you want to stick to your original entry plans. You look for price to break key levels instead of waiting for a signal. This key level will be the point you think price is strongly in favour of moving in your direction.

hello nick sir , its been 15 days i started this psychology to test in stocks . but i m not getting proper setup like Forex and difficult to manage 1:3 . so already i changed to 1:2 RR . according to our strategy is is possible to manage trades in stocks . or in stocks market condition is not working properly . Are you tried this strategy in stocks or not .thanks a lot

Thanks for all tips. I see in the example you use breakup and S/R but I don’t see how you implement candlestick pattern like doji, evening star etc, to spot reversal, pullback and continuation

I don’t use the conventional candlestick names – I just read the candle and interpret the story it is telling. The names are just ways to help you understand what the candlesticks are telling you but in actuality, you don’t need to memorize these names, just understand the fundamentals of candlestick analysis and you can read any candle in all shapes and forms.

I really love the attention you give to your work and your magnanimity in attending to people’s questions. I’m really amazed you’ve been at this since 2017. What you do here is what most people charge millions for amd funny enough, they take knowledge from people like you and sell. I hope you are been compensated for this nice work. Keep it up. More wins in your trades ☺️

Thanks for the kind words Nerci! It has been 15 years of work that has been well worth it and comments like these really do mean a lot for keeping my motivation high. Let’s hope the remainder of the year gives us some good results!

Hey Nick, I have a plan to open five positions hunting down 15 pips daily from the market making a return of $75 daily for the first month with a lot size of 0.1. When it works out as planned I hope to up the lot size to 0.5 maintaining the same five positions.
Please what are your thoughts on these?

kindest regards

There is no way to consistently make a specific amount of pips or dollars per day.

Thank you brother for adding knowledge to what I have been learning on price action after losing much money on indicators…

hello nick sir , its going good sir its improving trust the process . thanks for supporting

Hi Nick,
Thanks for all the efforts you put into this, please can you send me a video on how to place support and resistance on a 15 min chart ?

Hi Nick. Firstly, thanks for sharing the strategy.
I read some articles about breatout and pullback strategy. Consider the price pullbacks to the area of S/R and wanna retest it, hiw do u know it is the time to enter the trade. I mean, u have a candlestick pattern that shows u the price cant break this area and wanna continue the trend like wick rejection, etc. And u know sometimes it is difficult to identify the trend, do u have any advice to identify it properly, like MA.
Thank u for responding.

The proper placement of an entry is really the key issue here, alongside the identification of the trend. For your entry, placing it after higher highs/lower lows of recent price action is really important. It is essentially acting as the level at which you think price is going to keep going in your direction. So always look left and remember recent data is king. Identifying trend strength is aided by experience but you can judge the strength of a trend based on candlestick analysis. How large the bodies of candles are, the size of wicks, the length of the trend – all of these help to paint a story of who has control over price and the relative strength. You can use the 200 MA on the daily chart but this does lag. I prefer to use price action analysis because I can look at the most recent data as well as older data.

Hi Nick, Thanks for sharing with us. The Articles were very good to follow.

Absolutely loved ur website and YouTube channel Nick! I’m obsessed with ur strategy. it was exactly what I was looking for! keep us updated.. Thank u :**** <333

at last at last thank you mr nick at last

Hi Nick,
Really enjoyed your sharing on scalping 5mins chart.

It will really be good if you offer a separate Mastermind course for those who are only interested in scalping smaller timeframes.

This may happen in the future but not in 2021, sorry!

Hi, Nick..I’m a rrokie 22 trader, I learned lot of new stuff by reading your blog thanks for sharing

Hello Nick
I am sending a message from Iran
It was really great, I enjoyed it. A lot of my confusion was resolved

hai nick, thank you for sharing this knowledge to us.

Leave a Reply

Your email address will not be published. Required fields are marked *