This candlestick analysis article was written in 2008, while it is still perfectly valid today, I have expanded on the subjects discussed here.
To read my most current articles on candlestick analysis, check out my free price action strategy.
People are often told how to trade candlesticks by identifying patterns. The problem with identifying patterns is that you never learn what is behind the pattern. Why does the candle pattern form? What does the candle pattern mean? Why does the candle pattern mean what it means? Ask most professional traders these questions and they will not be able to answer.
In this two part series I will explain, in an easy but detailed way, what candle patterns are and how to read them properly.
Understanding Candle Patterns – Part One
Running Forex4noobs.com I often get to speak to newbie traders about their trading systems. Sometimes I have to hold back laughter when I see these overly complex indicator based systems. Most traders do not know that the candles on their charts give them so much more information than indicators ever will. Here is a short list of what some simple candle reading can tell a trader about current market conditions:
– Who has control of the market: the buyers or sellers (bulls or bears).
– When the market is ready to turn around i.e. bearish trend is dying and bullish trend is starting.
– What buyers and sellers are thinking and where the price is heading.
– When to take profits from an open position.
– When to hold an open position.
Overall being able to read Candlenese fluently will make you a more efficient trader.
Traders tend to look at candles and see these little boxes that tell them highs, lows, opens, and closes. However, candles are not so black and white, They are actually a window into the markets mind. They reflect to us what buyers and sellers are thinking and that information is invaluable to a trader. The only problem is you have to know how to read it…..
Can you Read Candle Patterns?
I am guessing you have already studied that huge list of candle patterns, with all those strange names, and you have probably already tried to commit all that drivel to memory. You know what though? It is impractical to remember all those patterns and what they mean. That list simply gives you the illusion of being able to read candle patterns, without ever actually learning how to read them. If you do not know what list of candle patterns I am talking about GOOD. Don’t even bother looking for it, as all you will be doing is filling your head with useless nonsense.
In this article, I am not just going to show you a pattern and tell you what that pattern means. That is the fools way of reading candles. In this article, I am going to teach you how to truly read a candle pattern. I am going to explain how and why candles form the way they do. This insight, I hope, will give you the knowledge and skills you need to be able to read candle patterns. So forget about all those stupid candle pattern names like dojis, hammers, and morning stars. Its time to learn how to read and interpret all candles by learning how and why they form.
Candle Reading For Dummies
Before we delve into reversal patterns, I am going to have to tell you what bullish and bearish candles are and what they mean. I know, I know, you’re not stupid but just keep reading because you might just learn something here. This is what I am talking about when I say black and white candles, seem like a black and white thing: very simple, no-thinking-needed. However, even these two basic types of candles can have little shades of grey hidden away deep inside. So let’s jump in and discuss bullish and bearish candles:
All Candles are Born Neutral
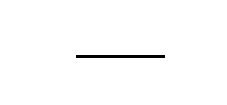
You might be thinking ‘what the heck is that?. Why has this nutter put a picture of a line up?’. Well that’s not just a line, that is a newborn baby candle. Isn’t it cute? That line up there is a neutral candle, it is a brand new candle that has yet to move a single pip in either direction. Candles are always born neutral. After birth they can grow to become either bearish, bullish or on rare occasions neither (what you probably know as Doji’s). When a candle is born we traders do not know what it will become. We can speculate but we do not truly know what a candle is until it dies (closes).
After a candle is born the battle begins. The bulls and the bears fight it out and the candle displays to us who is winning. If there are more buyers in the market you will see the candle move up and form a bullish candle. If there are more sellers you will see the candle move down and become a bearish candle. I know this is all very obvious but think about it for a second. That little candle is an indicator that tells us who is currently winning the battle, the bulls or the bears. Don’t you find that amazing? I certainly do!
Bullish Candles
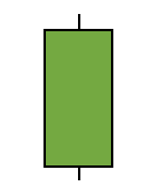
A bullish candle is what I call any candle that has a bullish body. So after our baby candle grows up and dies (closes) if it dies with a bullish body, it is a bullish candle. If it has a strong bullish body it is a strong bullish candle. If it has a small bullish body it is a weak bullish candle. Simple right? But think about it. The candle does not only tell you the price it tells you the bulls are winning, they have power. There are more buyers than sellers!
This is critical information in this market. If your system tells you to go short but the candle is clearly bullish, it might be a good idea to hold off on the short. Why would anybody go short when there are more buyers in the market?
Bearish Candles
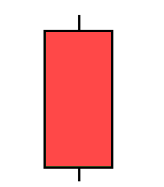
A bearish candle is what I call any candle that has a bearish body. So what does the bearish candle tell us? It tells us there are more sellers in the market than there are buyers. It tells us that the sellers are currently in control, so a long position would not be a great idea.
So what have we learned so far?
- Bullish Candle:There is currently more buying pressure in the market. As long as buyers maintain enough buying pressure the candles will be bullish. If buying pressure eases and selling pressure increases bullish candles will become smaller, representing decreased bull strength.
- Bearish Candle: There is currently more selling pressure in the market. As long as sellers maintain enough selling pressure the candles will be bearish. If selling pressure eases and buying pressure increases, bearish candles will become smaller, representing decreased bear strength.
Indecision Candle
If you have been trading for a while you’ve probably heard the term ‘reversal candle’. That term is a bit of a misnomer because the candles it refers to are not actually reversal candles, they should be called ‘indecision candles’.
Reading candles is easy you just need to put it in terms of a battle, between the bulls and the bears. I already explained that a candle with a bullish body indicates that the bulls are winning and a candle with the bearish body indicates that the bears are winning. We can say that because we are putting it in terms of a fight between the two. So what do candles like these ones tell us?
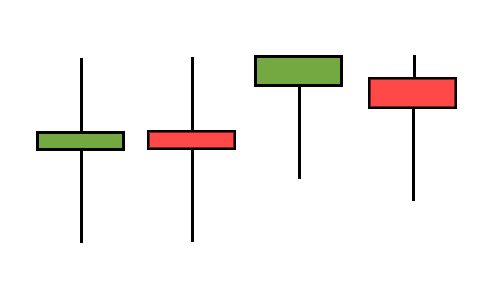
You may recognize these are reversal candles but I call them ‘indecision candles’ and here is why.
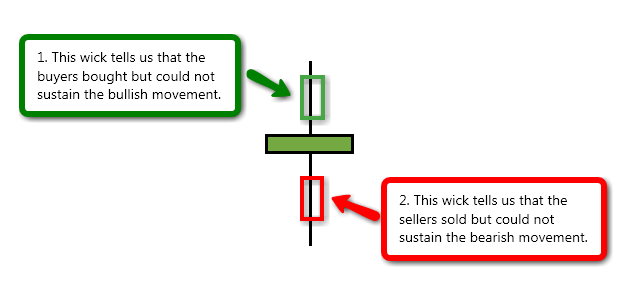
The candle tells us that nobody has really won the fight. Sure the candle has a tiny bullish body but overall they were held back from making a significant move. The bears too where obviously held back. They tried to move as the wick shows but they had no luck. So in the struggle the bears pushed down, the bulls pushed up, but they were near equally matched, so we did not see a significant break in either direction.
The point here is to stop looking at candles as shapes, look at them instead as the story of the battle between the bulls and bears. If the candle has a strong bullish body it means the buyers control the market. If it has a strong bearish body it indicates the sellers control the market. If the candle instead has a small body and a long wick, like the candle above, it tells us that the bulls and the bears have near equal amounts of strength so nobody is winning. Now I am going to throw in a dumb pic to illustrate what an indecision candle is:
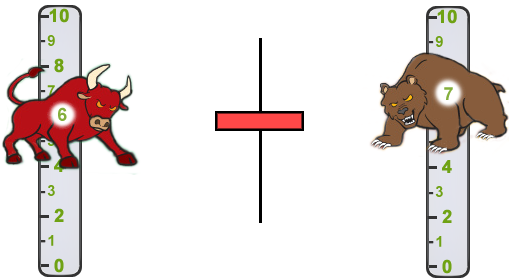
This is why an indecision candle is an indecision candle. The sliders have numbers from 0 to 10. When the bulls are at 10 it means they have a lot of power when they are at 0 it means they have no power. The same goes for the bears. So what happens when they are closely matched in terms of power? Thats right, an indecision candle forms. So when the bulls and bears have equal amounts of power you will get indecision. As soon as one side gains power the candle will show who has gained power.
In the picture below, we see that the bears have a lot of power and the bulls have very little, so now we have a large bearish candle.
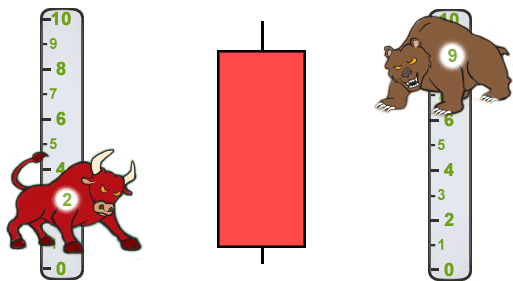
This should really drive home what the candles you know as reversal candles really mean. They do not indicate a reversal, they simply indicate that the bears and bull have equal power and that direction is undecided.
Shades of Grey
So stop thinking of candles as boxes that just show us highs, lows, opens, and closes. Candles tells us the story of the pair. They tell us when there are more buyers, when there are more sellers, and when the buyers and sellers are equally matched. These are the shades of gray I was talking about earlier.
The Three Parts Of a Reversal Trade
Even though an indecision candle is not a reversal candle, in the right context, it can indicate a possible reversal. An indecision pattern indicates a possible reversal when it forms after a strong move. The possible reversal is confirmed if the indecision candle is followed by a candle moving in the opposite direction. In the pictures below, you can see several examples of indecision patterns that you should consider reversal patterns.
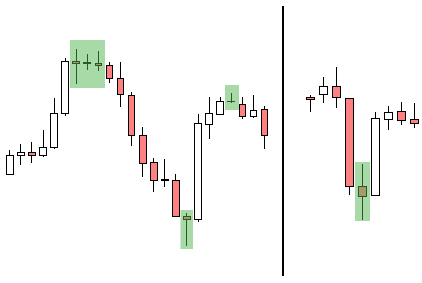
Why are these considered reversal patterns though? To answer that lets once again delve into the minds of buyers and sellers.
Preceding Trend
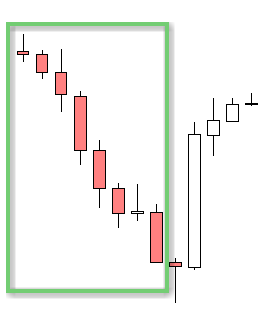
Ok so let’s look at the first part of a reversal. This is something I call the preceding trend/candle. Simply put, this is a strong move by the bull/bears indicating a lot of buying/selling pressure. In this example, the preceding trend/candle is a very strong bearish move, indicating that there are a lot of sellers in the market and very few buyers.
You may be thinking ‘why is a preceding trend/candle an essential part of a reversal?’. Well the answer is very simple. If an indecision candle forms without a preceding trend/candle what the heck could it possibly be reversing from? If it is not reversing from anything it cannot be considered a reversal candle, right? I will explain this a little more later. Now I am going to add another of these stupid pictures:
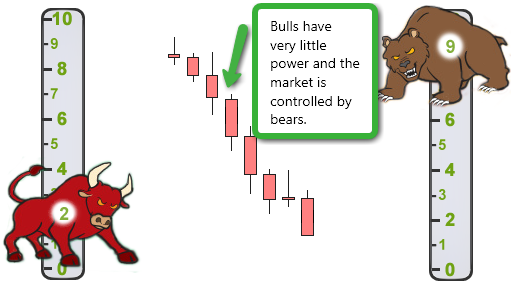
So this is the preceding bearish trend. You can see the bears have a lot of power while the bulls have very little. This is why the price is moving down, but then….
Indecision Candle
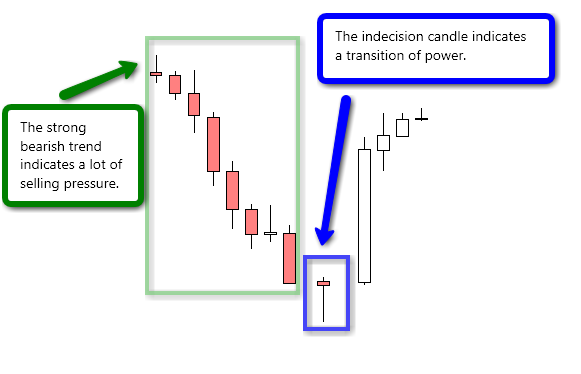
Look at that. We have an indecision candle forming in the middle of a strong bearish trend. Let’s think about what happened here for a second. In the picture above, we see that there was a lot of selling pressure and the bears had control. All of a sudden, we get this indecision pattern, and if you have been paying attention you know what that means. An indecision pattern means that the bulls and bears now have equal power. In other words, it means some sellers have left the market and some buyers are coming into the market. This transition of power is reflected by the indecision candle.
Reversal Confirmation
The reversal confirmation is the point at which, in the example above, buyers flood the market and selling pressure decreases. So now we have a bull controlled market and it begins to move up. A trade is entered somewhere on this candle.
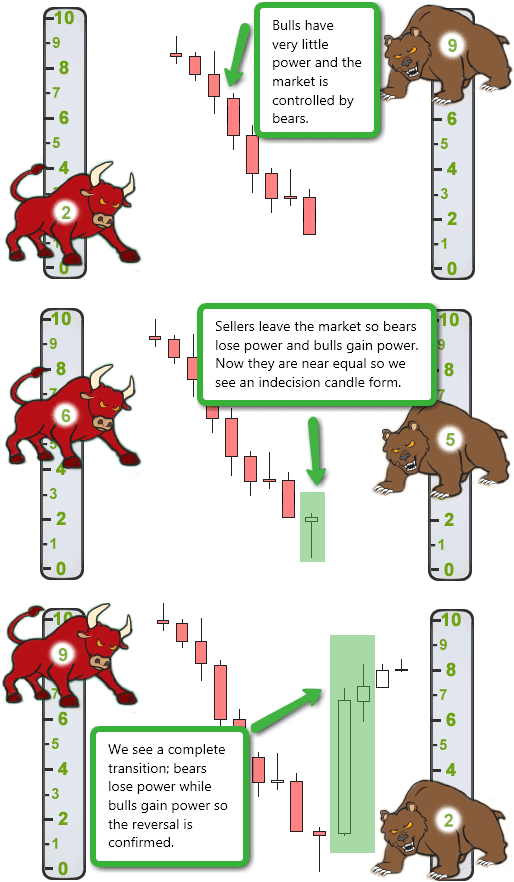
That is what a reversal trade is. We are looking for that transition of power. The indecision candle is our indicator that we might be about to see one. For more information on how and where I actually enter a reversal trade please refer to my Forex Trading Strategy. In this post, I want to give you a better understanding of what candles are, what they mean. Here are some more of the dumb power slider pics again that show the entire progression of a reversal trade.
How I Interpret My Charts
When I look at my charts, I am constantly thinking like this about the candles. I look at my candles and I can tell when the bulls are in power, when they are about to lose power, and when the bears are about to gain power. This is critical information and it really is extremely helpful to my trading. I read the candles on my chart like a story in a book and after having read that same story, thousands of times, I usually know what’s coming next. This is part of that intuition I always talk about. This is why I exit trades at the best times and why I rarely get caught in a losing trade. It is all about being able to read the candles and trading accordingly.
Price action questions?
If you have any questions about price action, and candlestick analysis, ask below.


Comments are closed.