Price action trading is built upon the foundation of your candlestick patterns.
This is your read on what the market is doing and what it will likely do in the future. It is vital that you have a strong understanding of price’s story if you are to be a successful trader.
Being independent and confident with your candlestick analysis is the first step toward becoming a truly independent trader. When mastered, candlestick patterns allows you to make profitable decisions from your own analysis.
I want to show you the fundamentals of candlestick analysis in a short and easy to understand guide. So if you want to build a solid foundation for your trading to progress from, look no further than this article!
Price Action’s Story
Whenever you are looking at your charts you are watching the struggle between buyers (bulls) and sellers (bears) play out. Both sides are in a constantly shifting relationship in regards to each side’s control over price.
As price action traders, it is our goal to analyze this price action to predict future movements of the market.
Candlestick analysis forms the foundation of our understanding of price action’s story. And the most important question we ask ourselves is “Who is in control of price?”.
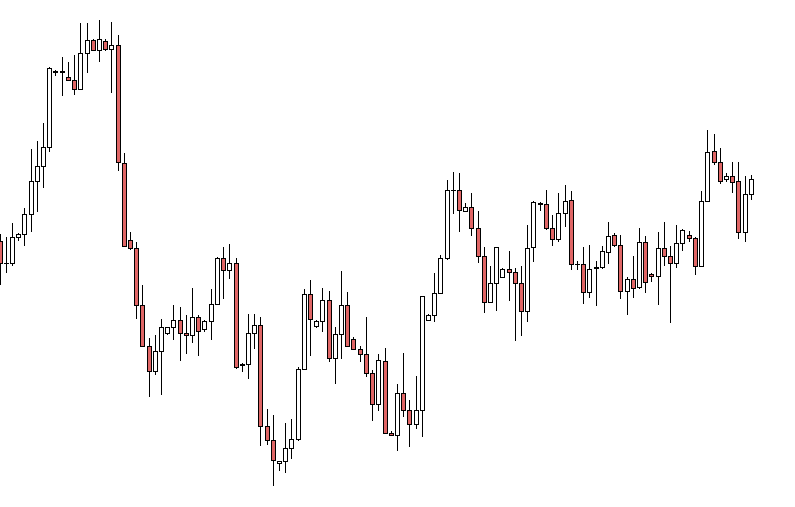
I use Japanese candlesticks in my trading because they give us a truck load of information that lets us answer that exact question. Look at the two charts below:


The information we can extract from the line chart compared to the candlestick chart is tiny!
A candlestick has 3 parts to it: the body, the upper wick, and the lower wick. Candlestick analysis is looking at these and understanding what the candle is telling us about price’s struggle.
The information it gives us informs our decisions on how much control bulls or bears have – this is done on individual candles but also groupings of them.
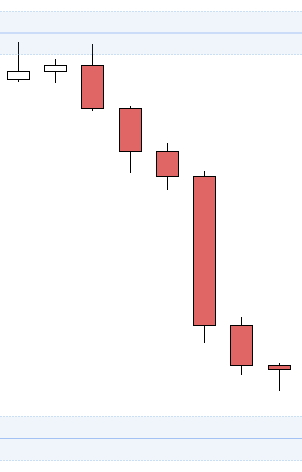
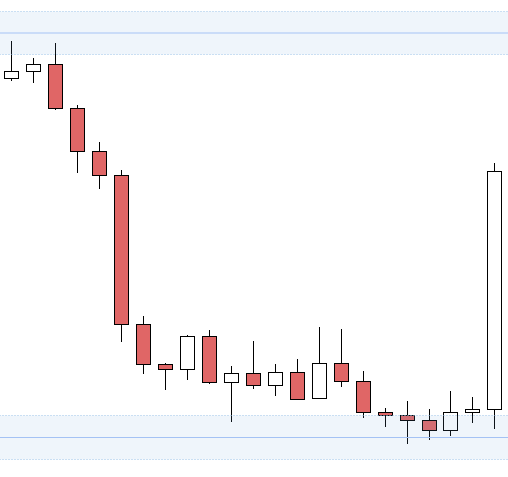
So when we look at a chart like this:
We know through candlestick analysis that bears had total control.
Once it approaches support and resistance, however, bears start to lose control and stall out, indicating to a price action trader that there is a barrier in the way (support and resistance).
You can see this by way of the smaller bodies and larger wicks.
It is the combination of understanding the story of individual candles and groups of candles that makes candlestick analysis so effective.
Predicting future movement of price is what trading is all about and the most recent data is the most relevant. This allows us to be flexible to all market conditions.
There is one type of candle that is of particular interest to us when carrying out candlestick analysis though.
Can you guess what type of candle?
Indecision Candles
The indecision candle is something we look out for in candlestick patterns, especially at support and resistance.
When we break them down, indecision candles are when buyers and sellers are at equal strength with one another.
No side has total control over price and we therefore see indecision form. It can form in many different ways and I am sure a lot of you have seen all types of names for candles that signal certain things.
You do not need to memorize all of these. It often makes traders confused and it is easy to mix them all up. But each of these named candles is just candlestick analysis.
It is a reading on what price action’s story is in the indecision candle. So if you see a candle like this at a support area:
…then you can understand what the candle is telling you by reading the candle’s story.
The body is small, near the entry so we know that no one is in control of price.
The upper wick is low so we know buyers weren’t able to push up high.
The lower wick, however, is quite large. This tells us a lot. Firstly, it tell us that sellers retained control for some time and actually pushed price down quite strongly.
However, it also tells us that sellers met resistance from buyers. That resistance was strong enough to push price back up to almost the entry of the candle.
This candle is on support so we are looking for a long trade here. As a trader, this candle should signal to you that there is buyer strength in the area which is encouraging for a long trade.
This does not mean you should enter the trade though!
Indecision is not an entry signal. It is simply telling you that no one has control over price in this area right now. Instead, it should signal to you that there is potential for a trade to form here.
It’s all well and good to show you some examples of candlestick analysis, but I want to go into a bit more detail on why so many traders use candlestick analysis and the benefits it gives us.
What Are The Benefits of Candlestick Patterns?
1. Access to Recent Data
At the core of candlestick analysis we have the trading advantage of accessing and analyzing the most recent data available to us. Why do we care so much about having access to the most recent data though?
Well, recent data tells us about the current struggle between bulls and bears mentioned in the previous section. This informs us on what we can expect to see in the immediate future.
Many indicators help you do this by looking at past data to give a forecast of the future.
However, these indicators are limited in what they can achieve because they lag behind the current price.
As price action traders, we can use candlestick analysis to assess price’s immediate story to make even stronger and more informed trading decisions.
2. Predict Future Market Movement
This leads to our second point – indicators lag but candlesticks don’t which means we can predict future market movement from this recent data.
Educated predictions about future market movement is what trading is all about. Candlestick analysis allows us to look at any candle on the chart and understand what price’s story is.
This is crucial because it can mean the difference between a good entry and a bad one. It can result in you catching a trade where you otherwise would have missed one.
Having the confidence in your own candlestick analysis to predict the future movement of price is the first step toward independent trading. This is why candlestick analysis is so valuable!
3. Precise Entries, Stop Losses, & Targets
I touched on this briefly just now, but candlestick analysis will actually allow you to have much higher quality trade parameters.
If you find yourself struggling with your entries, stop losses, and targets, go back to some of the basics of candlestick analysis. You’ll be surprised by the benefits of revisiting some of the more basic components of price action trading can have.
Candlestick analysis is easy to understand but it takes time to truly master. Going back with more experienced eyes will unveil more lessons. This often translates into better trade parameters based on thousands of my students’ experiences.
Finding those higher quality entries will reduce your risk in a big way. Easy to hit targets and hard to hit stops are going to increase your profitability.
All of this stems from your candlestick analysis so don’t gloss over it!
4. Flexibility
Last but certainly not least, candlestick analysis allows you to be flexible.
Flexibility in the forex market is a game changer.
You can adapt to market conditions immediately. You can trade on any time frame with candlestick analysis. You can trade a huge number of different setups.
Candlestick patterns do not restrict the trader in any way. So many opportunities are available to us because of this!
Adapting to the market and to any pair without relying on indicators or other traders is why price action trading is so popular and seen throughout all tradable markets.


